Download
1 / 76
760 likes | 767 Views
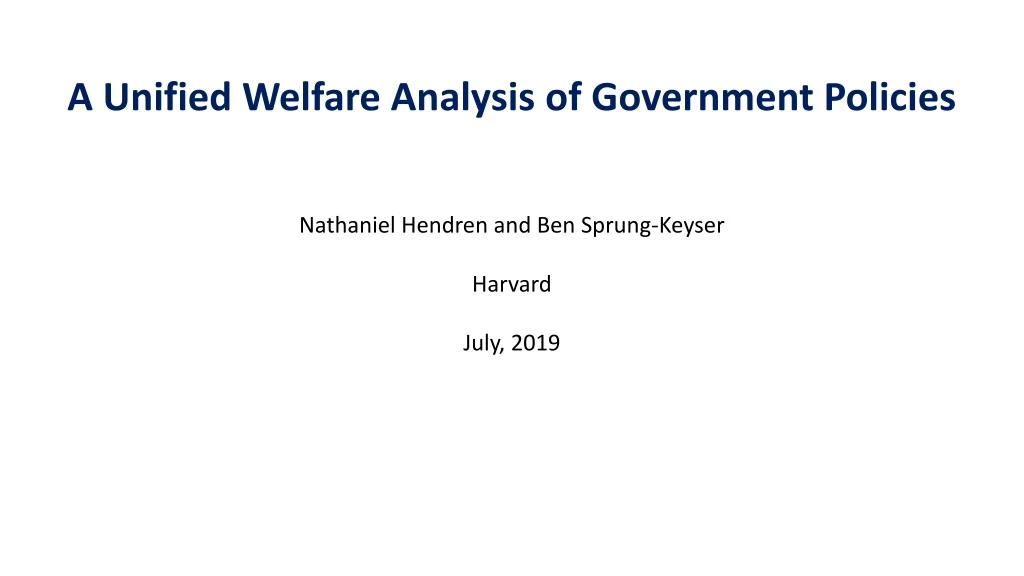
A Unified Welfare Analysis of Government Policies Nathaniel Hendren and Ben Sprung-Keyser Harvard July, 2019. A Unified Welfare Analysis of Government Policies. What government policies do the most to improve social welfare? Should we spend more (or less) on health insurance?

E N D
A Unified Welfare Analysis of Government Policies Nathaniel Hendren and Ben Sprung-Keyser Harvard July, 2019
A Unified Welfare Analysis of Government Policies • What government policies do the most to improve social welfare? • Should we spend more (or less) on health insurance? • Should we raise top marginal income tax rates? • Should we invest more in children? At what age? • There is existing research analyzing the effect of many of these policy changes • But little work quantifying the broad trade-offs across policy categories • Often different welfare methods used (CBA, MCPF, cost per life saved…) • This paper: Conducts a unified welfare analysis of historical policy changes in the US over the past half century • Study 133 policy changes spanning four major categories: Social insurance, education and job training, taxes and cash transfers, and in-kind transfers
Measuring the Marginal Value of Public Funds • For each policy change, we draw upon estimates in existing literature to measure: • The benefits to its recipients (measured as willingness to pay) • The net cost to the government (inclusive of fiscal externalities) • We take the ratio of benefits to net cost to form its Marginal Value of Public Funds: • Differs from traditional benefit/cost ratios by focusing on incidence of costs on government • Comparisons of MVPFs yield social welfare impacts • Suppose Policy 1 has and Policy 2 has • More spending on policy 1 financed by less on 2 increases social welfare iff prefer to take $2 from Policy 2 beneficiaries to give $1 to policy 1 beneficiaries • MVPF quantifies the tradeoffs across policies • Infinite MVPFs correspond to policies that pay for themselves ( and )
Data and Approach • Construct comprehensive sample of policy changes (more formally, “identification conditions”) from survey and review articles in the four domains • For each policy change, translate estimated impacts into the MVPF • Assess robustness to range of assumptions • Program Parameters (discount rate, tax rate, etc.) • Forecasting/Extrapolation of Observed Effects • Validity of Empirical Designs (RCTs/RDs vs. Diff-in-Diff; Peer Reviewed vs. not; etc.) • Publication Bias (Andrews and Kasy, 2018) • Missing Causal Estimates (e.g. restrict to subsets of policies with different sets of observed effects) • Detailed appendices + posted .do files on GitHub for exploration
Results Roadmap • Direct investments in low-income children have had the highest MVPFs • High MVPFs throughout childhood: K12, college and health, not just preschool • Many policies “pay for themselves” (e.g. 3 out of 4 child Medicaid expansions) • Lower MVPFs for policies targeting adults (MVPFs ranging from 0.5-2) • Several exceptions: • Children: Large variation in estimates with some low MVPFs (e.g. SSI) • Adults: Policies with indirect impacts on children (e.g. Moving to Opportunity) • Library of MVPFs provides tests of a range of theories (optimal taxation, in-kind vs cash transfers, optimal policy targeting, value of correcting market failures…) • Lessons for future welfare analyses • Comparison to traditional Benefit-Cost analysis • Statistical decision theory to quantify value of future work reducing uncertainty
Outline • What We Do: Our Method and An Example 1 2 3 4 WhatWe Find: MVPF Estimates and Robustness Relation to Previous Theory Lessons for Future Welfare Analyses
Admission to Florida International University • Florida International University (FIU) had a minimum GPA threshold for admission that created a fuzzy discontinuity • Zimmerman (2014) utilizes this discontinuity to examine the impact of FIU admission on earnings for 14 years after admission.
Net Cost to Government of Admission to Florida International University $10K 0 -10K -20K -30K Note: All amounts in 2005 USD, discounted using a 3% real interest rate
Net Cost to Government of Admission to Florida International University $11.4K $10K 0 -10K Cost per admission to FIU (IPEDS/Zimmerman (2014)) -20K -30K Total FIU Cost Note: All amounts in 2005 USD, discounted using a 3% real interest rate
Net Cost to Government of Admission to Florida International University $11.4K Student payments/loans contribute $3.2K $10K $-3.2K 0 -10K -20K -30K Total Student FIU Cost Contribution Note: All amounts in 2012 USD, discounted using CPI-U-RS and 3% real interest rate
Net Cost to Government of Admission to Florida International University $11.4K 5.6K reduction in community college govt spending $10K $-3.2K $-5.6K 0 -10K -20K -30K Total Student Community FIU Cost Contribution College Exp. Note: All amounts in 2012 USD, discounted using CPI-U-RS and 3% real interest rate
Net Cost to Government of Admission to Florida International University $11.4K $10K $-3.2K Net Upfront Gov’t Cost: 2.6K $-5.6K 0 -10K -20K -30K Total Student Community FIU Cost Contribution College Exp. Note: All amounts in 2012 USD, discounted using CPI-U-RS and 3% real interest rate
Net Cost to Government of Admission to Florida International University $11.4K Lost tax revenue from initial earnings declines from college attendance $10K $2.0K $-3.2K $-5.6K 0 -10K -20K -30K Total Student Community Taxes from age 19-25 earnings FIU Cost Contribution College Exp. Note: All amounts in 2012 USD, discounted using CPI-U-RS and 3% real interest rate
Net Cost to Government of Admission to Florida International University $11.4K $7.3K increase in tax revenue from ages 26-33 (18.6% tax+transfer, CBO) $10K $2.0K $-3.2K $-5.6K 0 $-7.3K -10K -20K -30K Taxes from age 26-33 earnings Total Student Community Taxes from age 19-25 earnings FIU Cost Contribution College Exp. Note: All amounts in 2012 USD, discounted using CPI-U-RS and 3% real interest rate
Net Cost to Government of Admission to Florida International University Net government savings of $2.7K by age 33 $11.4K $10K $2.0K $-3.2K $-5.6K 0 $-7.3K $-2.7K -10K -20K 17.2+2.7+11.4 -30K Taxes from age 26-33 earnings Total Student Community Taxes from age 19-25 earnings Net Cost To FIU Cost Contribution College Exp. Government Note: All amounts in 2012 USD, discounted using CPI-U-RS and 3% real interest rate
Net Cost to Government of Admission to Florida International University $11.4K $10K $2.0K $-3.2K $-5.6K 0 $-7.3K $-2.7K -10K Policy pays for itself -20K -30K Taxes from age 26-33 earnings Total Student Community Taxes from age 19-25 earnings Net Cost To FIU Cost Contribution College Exp. Government Note: All amounts in 2012 USD, discounted using CPI-U-RS and 3% real interest rate
Net Cost by Age to Government of Admission to Florida International University 40k 20k Observe outcomes through age 33 0 Cumulative Govt Cost What about future ages? Forecast future earnings using cross-section in ACS, following previous literature (e.g. Chetty, Hendren, Katz (2016)) -20k -40k 0 10 20 30 40 50 60 70 Age
Forecasting Future Earnings using the Cross-sectional Age Distribution Mean 2015 ACS Earnings by Age with 0.5% Growth 40k 60k 50k 20k 40k 0 Wage Cumulative Govt Cost 30k 20k -20k 10k -40k 0 0 10 20 30 40 50 60 70 Age
Forecasting Future Earnings using the Cross-sectional Age Distribution Control Group Earnings 40k 60k 50k 20k 40k 0 Wage Cumulative Govt Cost 30k Control group earnings are 97% of mean earnings at age 30 20k -20k 10k -40k 0 0 10 20 30 40 50 60 70 Age
Forecasting Future Earnings using the Cross-sectional Age Distribution Control Group Forecast 40k 60k 50k 20k 40k 0 Wage Cumulative Govt Cost 30k Assume constant % of mean earnings over life-cycle 20k -20k 10k -40k 0 0 10 20 30 40 50 60 70 Age
Forecasting Future Earnings using the Cross-sectional Age Distribution Control Group Earnings + Treatment Effect 40k 60k Add Treatment Effect to Control Group Earnings 50k 20k 40k 0 Wage Cumulative Govt Cost 30k 20k -20k 10k -40k 0 0 10 20 30 40 50 60 70 Age
Forecasting Future Earnings using the Cross-sectional Age Distribution • Treatment Group Forecast Forecast assuming constant % impact on earnings 40k 60k 50k 20k 40k 0 Wage Cumulative Govt Cost 30k 20k -20k 10k -40k 0 0 10 20 30 40 50 60 70 Age
Net Cost by Age to Government of Admission to Florida International University Forecasting Future Tax/Transfer Revenue Original $11.4K cost returns $24.4K to the government over the person’s lifetime 40k 20k 0 Cumulative Govt Cost -20k -40k 0 10 20 30 40 50 60 70 Age
Individuals WTP at least $2.9K out-of-pocket tuition for admission into FIU Conservative WTP Estimate Willingness to Pay for Admission into Florida International University Conservative WTP 100K 50K WTP ($) $2.9K 0 -25K WTP via private tuition payments
Willingness to Pay for Admission into Florida International University Baseline WTP 100K • Baseline Estimate: Value WTP using impact on net after-tax income • Valid if no impact on labor effort/disutility and no other impact of education on utility 50K WTP ($) $2.9K 0 -25K WTP via private tuition payments
$95.5K $112.8K 100K 50K WTP ($) $29.1K $2.9K 0 $-2.9K $-8.9K -25K WTP via Private tuition Age 19-25 Age 26-33 Age 34+ Baseline private tuition payments after-tax after-tax after-tax WTP payments earnings earnings earnings Willingness to Pay for Admission into Florida International University Baseline WTP
Outline • What We Do: Our Method and An Example 1 2 3 4 WhatWe Find: MVPF Estimates and Robustness Relation to Previous Theory • Lessons for Future Welfare Analyses
Direct Investments in Children Historically Had Highest MVPFs FIU GPA ∞ >5 4 3 MVPF 2 1 0 <-1 0 20 40 60 80 Age of Beneficiaries
Cash Transfers Direct Investments in Children Historically Had Highest MVPFs Child Education College Adult Cal Grant GPA College Child AOTC (SS) MC Child 83+ MC Pregnant & Infants MTO FIU GPA Disability Ins. Tuition Deduc (SS) ∞ Tuition Deduc (SE) Top Tax 1981 Health Adult Texas Pell MC Child (State Exp) Health Child HTC (JS) K12 Spend Perry Preschool HTC (SE) AOTC (JS) Housing Vouchers AOTC (IS) CC Mich >5 Top Tax 1986 Job Training HTC (IS) CC Texas Abecedarian MTO Soc Sec College MC Intro Florida Grant DC Grant AOTC (SI) HOPE Cred. Nutrition 4 College Spend Georgia HOPE Supp. Sec. Inc. NSW Ex-Offender UI Dur (MO) NSW Women HCV RCT to Welfare Top Taxes Mass HI (150%FPL) JTPA Adult Adult Pell SNAP Intro 3 TN Hope Unemp. Ins. Mass HI (250%FPL) Paycheck+ HTC (JE) MVPF Alaska UBI Oregon Health Top Tax 1993 Ohio Pell UI Ben (RK) UI Ben (GA) Top Tax 2001 2 Kalamazoo Top Tax 2013 Work Advance EITC 1986 WI Scholarship Mass HI (200%FPL) Medicare Intro CUNY Pell DI Generosity AFDC Term Limits College Tuition SNAP Assist DI Veterans 1 SSI Review TN Pell SNAP Info MA Scholarship Tuition Deduc (JE) UI Ben (NY) DI Examiner NSW Youth EITC 1993 Medigap Tax UI Ben (MO Exp) Year Up SSI Judge JobStart AFDC Generosity 0 UI Ben (MO Rec) Job Corps HCV Chicago Lottery UI Ben (DD w UR) JTPA Youth DI Judge UI Ben (DD) Tuition Deduc (JS) UI Ben (State Max) AOTC (SE) NSW Ex-Addict Cal Grant Inc HOPE/LLC SNAP Imm. UI Dur (DD) <-1 AOTC (JE) HTC (SS) Neg Inc Tax 0 20 40 60 80 Age of Beneficiaries
Cash Transfers Direct Investments in Children Historically Had Highest MVPFs Child Education College Adult Cal Grant GPA College Child AOTC (SS) MC Child 83+ MC Pregnant & Infants MTO FIU GPA Disability Ins. Tuition Deduc (SS) ∞ Tuition Deduc (SE) Top Tax 1981 Health Adult Texas Pell MC Child (State Exp) Health Child HTC (JS) K12 Spend Perry Preschool HTC (SE) AOTC (JS) Housing Vouchers AOTC (IS) CC Mich >5 Top Tax 1986 Job Training HTC (IS) CC Texas Abecedarian MTO Soc Sec College MC Intro Florida Grant DC Grant AOTC (SI) HOPE Cred. Nutrition 4 College Spend Georgia HOPE Supp. Sec. Inc. NSW Ex-Offender UI Dur (MO) High MVPFs for policies targeting children NSW Women HCV RCT to Welfare Top Taxes Mass HI (150%FPL) JTPA Adult Adult Pell SNAP Intro 3 TN Hope Unemp. Ins. Mass HI (250%FPL) Paycheck+ HTC (JE) MVPF Alaska UBI Oregon Health Top Tax 1993 Ohio Pell UI Ben (RK) UI Ben (GA) Top Tax 2001 2 Kalamazoo Top Tax 2013 Work Advance EITC 1986 WI Scholarship Mass HI (200%FPL) Medicare Intro CUNY Pell DI Generosity AFDC Term Limits College Tuition SNAP Assist DI Veterans 1 SSI Review TN Pell SNAP Info MA Scholarship Tuition Deduc (JE) UI Ben (NY) DI Examiner NSW Youth EITC 1993 Medigap Tax UI Ben (MO Exp) Year Up SSI Judge JobStart AFDC Generosity 0 UI Ben (MO Rec) Job Corps HCV Chicago Lottery UI Ben (DD w UR) JTPA Youth DI Judge UI Ben (DD) Tuition Deduc (JS) UI Ben (State Max) AOTC (SE) NSW Ex-Addict Cal Grant Inc HOPE/LLC SNAP Imm. UI Dur (DD) <-1 AOTC (JE) HTC (SS) Neg Inc Tax 0 20 40 60 80 Age of Beneficiaries
Cash Transfers Direct Investments in Children Historically Had Highest MVPFs Child Education College Adult Cal Grant GPA College Child AOTC (SS) MC Child 83+ MC Pregnant & Infants MTO FIU GPA Disability Ins. Tuition Deduc (SS) ∞ Tuition Deduc (SE) Top Tax 1981 Health Adult Texas Pell MC Child (State Exp) Health Child HTC (JS) K12 Spend Perry Preschool HTC (SE) AOTC (JS) Housing Vouchers AOTC (IS) CC Mich >5 Top Tax 1986 Job Training HTC (IS) CC Texas Abecedarian MTO Soc Sec College MC Intro Florida Grant DC Grant AOTC (SI) HOPE Cred. Nutrition 4 College Spend Georgia HOPE Supp. Sec. Inc. NSW Ex-Offender UI Dur (MO) NSW Women HCV RCT to Welfare Top Taxes Mass HI (150%FPL) JTPA Adult Adult Pell SNAP Intro 3 TN Hope Unemp. Ins. Mass HI (250%FPL) Lower MVPFs for policies targeting adults Paycheck+ HTC (JE) MVPF Alaska UBI Oregon Health Top Tax 1993 Ohio Pell UI Ben (RK) UI Ben (GA) Top Tax 2001 2 Kalamazoo Top Tax 2013 Work Advance EITC 1986 WI Scholarship Mass HI (200%FPL) Medicare Intro CUNY Pell DI Generosity AFDC Term Limits College Tuition SNAP Assist DI Veterans 1 SSI Review TN Pell SNAP Info MA Scholarship Tuition Deduc (JE) UI Ben (NY) DI Examiner NSW Youth EITC 1993 Medigap Tax UI Ben (MO Exp) Year Up SSI Judge JobStart AFDC Generosity 0 UI Ben (MO Rec) Job Corps HCV Chicago Lottery UI Ben (DD w UR) JTPA Youth DI Judge UI Ben (DD) Tuition Deduc (JS) UI Ben (State Max) AOTC (SE) NSW Ex-Addict Cal Grant Inc HOPE/LLC SNAP Imm. UI Dur (DD) <-1 AOTC (JE) HTC (SS) Neg Inc Tax 0 20 40 60 80 Age of Beneficiaries
>5 4 3 MVPF 2 1 0 <-1 0 20 Cash Transfers Direct Investments in Children Historically Had Highest MVPFs With 95% Confidence Intervals Child Education College Adult College Child Disability Ins. ∞ Health Adult Health Child Housing Vouchers Job Training MTO Nutrition Supp. Sec. Inc. Top Taxes Unemp. Ins. 40 60 80 Age of Beneficiaries
>5 4 3 MVPF 2 1 0 <-1 0 20 40 60 80 Age of Beneficiaries Cash Transfers Direct Investments in Children Historically Had Highest MVPFs Child Education College Adult College Child Disability Ins. ∞ Health Adult Health Child Housing Vouchers Job Training MTO Imagine spending $1 in initial program cost on each domain Nutrition Supp. Sec. Inc. Top Taxes Unemp. Ins.
Direct Investments in Children Historically Had Highest MVPFs Category Averages Child Education ∞ College Child Health Child >5 4 3 Top Taxes MVPF Cash Transfers 2 Housing Vouchers Supp. Sec. Inc. 1 Disability Ins. Unemp. Ins. Health Adult Job Training 0 Nutrition <-1 College Adult 0 20 40 60 80 Age of Beneficiaries
Net Costs to Government per $1 of Initial Expenditure • Category Averages >2 1 Cost Over Program Cost 0 Child Education College Child Health Child -1 <-2 0 20 40 60 80 Age of Beneficiaries
Net Costs to Government per $1 of Initial Expenditure • Category Averages >2 Unemp. Ins. Nutrition Health Adult Supp. Sec. Inc. Housing Vouchers Disability Ins. 1 Cash Transfers Job Training College Adult Top Taxes Cost Over Program Cost 0 Child Education College Child Health Child -1 <-2 0 20 40 60 80 Age of Beneficiaries
Not All Child-Targeted Policies Have High MVPFs ∞ >5 4 3 MVPF 2 1 SSI Review MA Scholarship 0 Job Corps <-1 0 20 40 60 80 Age of Beneficiaries
>5 4 3 MVPF 2 1 0 <-1 0 20 40 60 80 Age of Beneficiaries Infinite MVPF for 1981 Top Tax Rate… Top Tax 1981 ∞
>5 4 3 MVPF 2 1 0 <-1 0 20 40 60 80 Age of Beneficiaries Infinite MVPF for 1981 Top Tax Rate… Top Tax 1981 ∞
>5 4 3 MVPF 2 1 0 <-1 0 20 40 60 80 Age of Beneficiaries Policies with Spillovers onto Children Have High MVPFs (e.g. MTO) MTO ∞
MVPF Robustness to Alternative Discount Rates 3% discount rate Child Education ∞ Health Child College Child >5 4 3 Top Taxes MVPF Cash Transfers 2 Housing Vouchers Supp. Sec. Inc. 1 Health Adult Disability Ins. Unemp. Ins. Job Training 0 Nutrition College Adult <-1 0 20 40 60 80 Age of Beneficiaries
MVPF Robustness to Alternative Discount Rates • 7% discount rate ∞ Health Child >5 College Adult College Child Child Education 4 3 Top Taxes MVPF Cash Transfers 2 Housing Vouchers Supp. Sec. Inc. 1 Health Adult Disability Ins. Unemp. Ins. Job Training 0 Nutrition <-1 0 20 40 60 80 Age of Beneficiaries More
MVPF Robustness to Alternative Tax and Transfer Rates • 10% Tax and Transfer Rate Health Child ∞ Child Education College Child >5 College Adult 4 3 Top Taxes MVPF Cash Transfers 2 Supp. Sec. Inc. Housing Vouchers 1 Health Adult Disability Ins. Unemp. Ins. Job Training Nutrition 0 <-1 0 20 40 60 80 Age of Beneficiaries
MVPF Robustness to Alternative Tax and Transfer Rates • 30% Tax and Transfer Rate Health Child ∞ Child Education College Child >5 4 3 Top Taxes MVPF Cash Transfers 2 Supp. Sec. Inc. Housing Vouchers 1 Health Adult Disability Ins. Unemp. Ins. Job Training Nutrition 0 College Adult <-1 0 20 40 60 80 Age of Beneficiaries
MVPFs for Restricted Sample Excluding College-Based Extrapolations Health Child ∞ Child Education College Child >5 4 3 Top Taxes MVPF 2 Supp. Sec. Inc. Cash Transfers 1 Health Adult Disability Ins. Unemp. Ins. Job Training Nutrition 0 <-1 0 20 40 60 80 Age of Beneficiaries
MVPF Robustness to WTP • Conservative Willingness to Pay Health Child College Child ∞ Child Education >5 4 3 Top Taxes MVPF College Adult 2 Cash Transfers Housing Vouchers Supp. Sec. Inc. Disability Ins. 1 Health Adult Nutrition Unemp. Ins. 0 Job Training <-1 0 20 40 60 80 Age of Beneficiaries WTP/Prog. cost
MVPF Robustness to Forecasting Assuming Fixed Income over Life Cycle (No Income Growth, Restricted Sample) Health Child ∞ Child Education College Child >5 4 3 Top Taxes MVPF 2 Supp. Sec. Inc. Cash Transfers 1 Health Adult Disability Ins. Unemp. Ins. Job Training Nutrition 0 <-1 0 20 40 60 80 Age of Beneficiaries No Forecast Child Spillovers
MVPF Robustness to Sample/Specification Quality Peer-Reviewed Studies Health Child Child Education ∞ College Adult College Child >5 4 3 Top Taxes MVPF Housing Vouchers 2 Supp. Sec. Inc. Cash Transfers 1 Health Adult Disability Ins. Unemp. Ins. Nutrition 0 <-1 0 20 40 60 80 Age of Beneficiaries