Download
1 / 1
20 likes | 133 Views
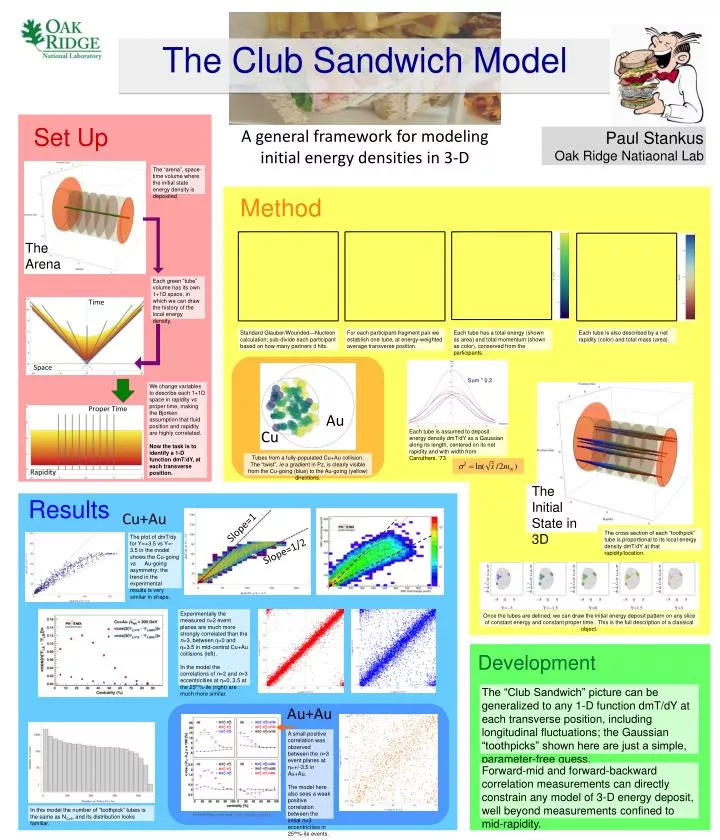
Set Up. A general framework for modeling initial energy densities in 3-D. Paul Stankus Oak Ridge Natiaonal Lab. The “arena”, space-time volume where the initial state energy density is deposited. Method. The Arena. The Club Sandwich Model.

E N D
Set Up A general framework for modeling initial energy densities in 3-D Paul StankusOak Ridge Natiaonal Lab The “arena”, space-time volume where the initial state energy density is deposited Method The Arena The Club Sandwich Model Each green “tube” volume has its own 1+1D space, in which we can draw the history of the local energy density. Time Standard Glauber/Wounded—Nucleon calculation; sub-divide each participant based on how many partners it hits. For each participant-fragment pair we establish one tube, at energy-weighted average transverse position. Each tube has a total energy (shown as area) and total momentum (shown as color), conserved from the participants. Each tube is also described by a net rapidity (color) and total mass (area). Space Sum * 0.2 We change variables to describe each 1+1D space in rapidity vs proper time, making the Bjorken assumption that fluid position and rapidity are highly correlated. Now the task is to identify a 1-D function dmT/dY, at each transverse position. Proper Time Au Cu Each tube is assumed to deposit energy density dmT/dY as a Gaussian along its length, centered on its net rapidity and with width from Carruthers, ‘73 Tubes from a fully-populated Cu+Au collision. The “twist”, ie a gradient in Pz, is clearly visible from the Cu-going (blue) to the Au-going (yellow) directions. Rapidity The Initial State in 3D Results Cu+Au Slope=1 The cross section of each “toothpick” tube is proportional to its local energy density dmT/dY at that rapidity/location. The plot of dmT/dy for Y=+3.5 vs Y=-3.5 in the model shows the Cu-going vs Au-going asymmetry; the trend in the experimental results is very similar in shape. Slope=1/2 Experimentally the measured n=2 event planes are much more strongly correlated than the n=3, between η=0 and η=3.5 in mid-central Cu+Au collisions (left). In the model the correlations of n=2 and n=3 eccentricities at η=0, 3.5 at the 25th%-ile (right) are much more similar. Once the tubes are defined, we can draw the initial energy deposit pattern on any slice of constant energy and constant proper time. This is the full description of a classical object. Development The “Club Sandwich” picture can be generalized to any 1-D function dmT/dY at each transverse position, including longitudinal fluctuations; the Gaussian “toothpicks” shown here are just a simple, parameter-free guess. Au+Au A small positive correlation was observed between the n=3 event planes at η=+/-3.5 in Au+Au. The model here also sees a weak positive correlation between the initial n=3 eccentricities in 25th%-ile events. Forward-mid and forward-backward correlation measurements can directly constrain any model of 3-D energy deposit, well beyond measurements confined to mid-rapidity. In this model the number of “toothpick” tubes is the same as NColl, and its distribution looks familiar. PHENIX Phys. Rev. Lett. 107, 252301 (2011)