Download
1 / 22
220 likes | 226 Views
Warm molecular gas and starburst in three nearby major mergers. Junzhi Wang (PMO) Sep 28, 2006 Collaborators: Qizhou Zhang(CFA), Yuefang Wu(PKU), Zhong Wang(CFA), Paul T.P. Ho(ASIAA), Giovanni G. Fazio(CFA), kazushi Sakamoto(NAOJ), Daisuke Iono(NAOJ). Star formation. Galaxies. Cosmology.

E N D
Warm molecular gas and starburst in three nearby major mergers Junzhi Wang (PMO) Sep 28, 2006 Collaborators: Qizhou Zhang(CFA), Yuefang Wu(PKU), Zhong Wang(CFA), Paul T.P. Ho(ASIAA), Giovanni G. Fazio(CFA), kazushi Sakamoto(NAOJ), Daisuke Iono(NAOJ)
Star formation Galaxies Cosmology
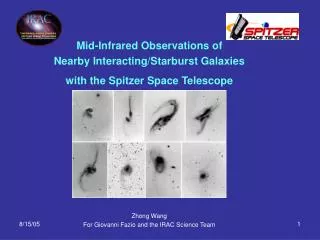
Scientific motivation • Why CO 3-2 ? CO 1-0 and 2-1 trace the total molecular gas, while CO 3-2 (Tex~30K) traces the star forming gas Dense gas tracers (HCN,CS) are too weak (~1/10 of CO) • Why interferometer? need high resolution (sub-arcsecond to arcseconds) to resolve the gas distribution • Why PAH at 8.0um? The best tracer of star formation rate: FAR-IR can not archive high resolution
The sample • NGC 4038/39 (early stage merger,19Mpc) • NGC 6090 (mid-stage merger,122Mpc) • Arp 220 (advanced merger, 77Mpc)
Observations for the three mergers • The high resolution CO 3-2 observations with the SMA • The high resolution and high sensitivity mid-IR imaging with the IRAC in the Spitzer Space Telescope • For NGC 6090, the CO 2-1 with the SMA and the near-IR Ks band image with MMT have also been observed
View of theSMA in the directionof Mauna Loa (Ho et al. 2004) • The first and the only interferometer working at sub-mm now • Resolution: from several arcseconds to sub-arcsecond
NGC 4038/39 • The “Antennae” galaxy • Nearest major merger • Distance: 19 Mpc • Early stage merger of two gas-rich spirals • Projected separation: 6.5kpc (70 ") • LIR: 6.2x10¹⁰Lsun(so it is not a LIRG)
NGC4038 Optical image with HST (Whitmore et al. 1999) DSS image, the tails Overlap region NGC4039
Red contour:CO 3-2 NGC4038 Grey scale: CO 1-0, data from Wilson et al. (2000) Overlap region NGC4039
3.6 µm NGC4038 4.5 µm Overlap region NGC4039 8.0 µm 5.8 µm
Grey scale: CO 1-0 Green: H Red: CO 3-2 Grey scale: H Green: IRAC 8.0 Red: CO 3-2 B B A A C C H data from Xu et al. (2000), CO 1-0 from Wilson et al. (2000)
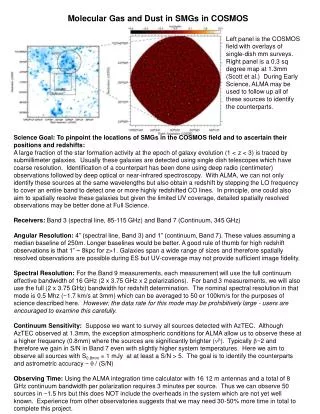
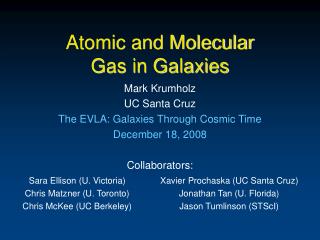
NGC 6090 • Mid-stage merger • Distance: 122Mpc • Projected separation: 3.2 kpc (5.4") • LIRG: LIR: 3x10¹¹ Lsun • A gas-rich merger: MH2=3x10¹⁰ Msun
HST near-IR image (Dinshaw et al. 1999) NGC6090E Overlap region NGC6090W
Both CO 2-1 and CO 3-2 peaking at the overlap region! Red contour: CO 2-1 Grey scale: Ks Two stars: 20cm peaks Green contour: CO 3-2 Wang, J., et al.,2004, ApJ, 616, L67
3.6 µm Grey scale:Ks Contour: IRAC data 4.5 µm Most of the mid-IR emission comes from the face-on galaxy, and the emission peak of the 8.0µm is not the same as that of the other bands 5.8 µm 8.0µm
NGC6090E NGC6090W SDSS G band 4700A MMT Ks band The two galaxies show different properties, it seems NGC 6090E is dust and gas rich, while NGC 6090W is poor of dust and gas
Arp 220 • The nearest ULIRG • Advanced merger • Distance: 77Mpc • LIR: 1.4x10¹² Lsun • Projected separation: 370pc (1")
Contour: Integrated intensity map of CO 3-2 Grey scale: 6cm continuum Mean velocity map of CO 3-2, grey scale and contours The first sub-arcsecond data for the galaxies with the SMA
Contour: Integrated intensity map of CO 3-2 Grey scale: 6cm continuum Contour: Integrated intensity map of CO 2-1 Grey scale: 6cm continuum The molecular gas toward the east (left) nucleus is warmer than that toward the west nucleus! CO 2-1 data from Sakamoto et al. (1999)
345GHz can better trace the far-IR emission distribution than the 230GHz, and show different distribution! Grey scale: 6cm continuum Red contour: 230 GHz continuum Green contour: 345 GHz continuum 230GHz data from Sakamoto et al. (1999)
Summary Starburst during the merging process is complex The star forming gas tracer CO 3-2 shows different distribution to the total molecular gas tracer CO 1-0, which means only some of the molecular gas are forming stars Starburst in the overlap region can be more active than the nuclear region, such as NGC 4038/39 Starburst did not start at the same time at different places, and the location of the starburst is not only related to the merging stage. (The trigger of the starburst?)