Download
1 / 205
2.05k likes | 2.05k Views
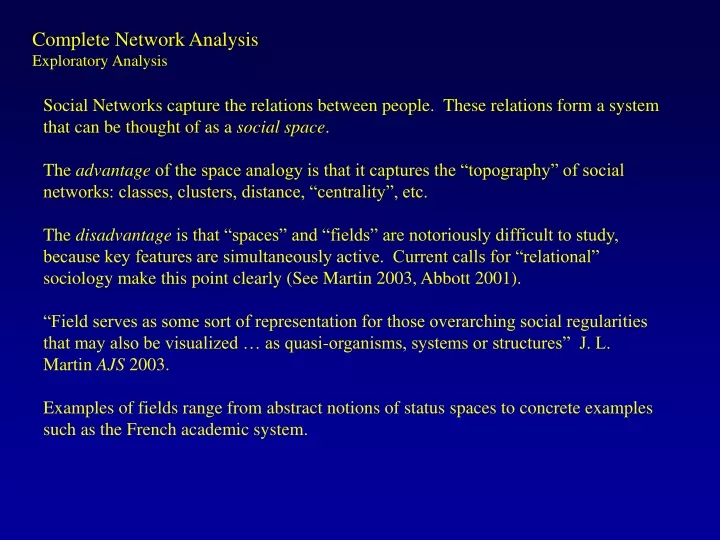
Complete Network Analysis Exploratory Analysis. Social Networks capture the relations between people. These relations form a system that can be thought of as a social space .

E N D
Complete Network Analysis Exploratory Analysis Social Networks capture the relations between people. These relations form a system that can be thought of as a social space. The advantage of the space analogy is that it captures the “topography” of social networks: classes, clusters, distance, “centrality”, etc. The disadvantage is that “spaces” and “fields” are notoriously difficult to study, because key features are simultaneously active. Current calls for “relational” sociology make this point clearly (See Martin 2003, Abbott 2001). “Field serves as some sort of representation for those overarching social regularities that may also be visualized … as quasi-organisms, systems or structures” J. L. Martin AJS 2003. Examples of fields range from abstract notions of status spaces to concrete examples such as the French academic system.
Complete Network Analysis Exploratory Analysis Bourdieu “Social Space and Symbolic Space” Sociologists often use spatial analogies, such as MDS or correspondence analysis, based on patterns of actor attributes. Social Network Analysis lets you explore the relational space directly, by mapping relations directly. The first step in this exploration is often visualizing the network.
Complete Network Analysis Exploratory Analysis: Network visualization Network visualization helps build intuition, but you have to keep the drawing algorithm in mind: Spring-embeder layouts Tree-Based layouts Most effective for very sparse, regular graphs. Very useful when relations are strongly directed, such as organization charts, internet connections, Most effective with graphs that have a strong community structure (clustering, etc). Provides a very clear correspondence between social distance and plotted distance Two images of the same network
Complete Network Analysis Exploratory Analysis: Network visualization Network visualization helps build intuition, but you have to keep the drawing algorithm in mind: Spring-embeder layouts Tree-Based layouts Two images of the same network
Complete Network Analysis Exploratory Analysis: Network visualization • Network visualization helps build intuition, but you have to keep the drawing algorithm in mind. • Hierarchy & Tree models • Use optimization routines to add meaning to the “Y-axis” of the plot. This makes it possible to easily see who is most central because of who is on the top of the figure. Usually includes some routine for minimizing line-crossing. • Spring Embedder layouts • Work on an analogy to a physical system: ties connecting a pair have ‘springs’ that pull them together. Unconnected nodes have springs that push them apart. The resulting image reflects the balance of these two features. This usually creates a correspondence between physical closeness and network distance.
Complete Network Analysis Exploratory Analysis: Network visualization
Complete Network Analysis Exploratory Analysis: Network visualization Using colors to code attributes makes it simpler to compare attributes to relations. Here we can assess the effectiveness of two different clustering routines on a school friendship network.
Complete Network Analysis Exploratory Analysis: Network visualization As networks increase in size, the effectiveness of a point-and-line display diminishes, because you simply run out of plotting dimensions. I’ve found that you can still get some insight by using the ‘overlap’ that results in from a space-based layout as information. Here you see the clustering evident in movie co-staring for about 8000 actors.
Complete Network Analysis Exploratory Analysis: Network visualization As networks increase in size, the effectiveness of a point-and-line display diminishes, because you simply run out of plotting dimensions. I’ve found that you can still get some insight by using the ‘overlap’ that results in from a space-based layout as information. This figure contains over 29,000 social science authors. The two dense regions reflect different topics.
Complete Network Analysis Exploratory Analysis: Network visualization Adding time to social networks is also complicated, as you run out of space to put time in most network figures. One solution is to animate the network. Here we see streaming interaction in a classroom, where the teacher (yellow square) has trouble maintaining order. The SONIA software program (McFarland and Bender-deMoll) will produce these figures.
Complete Network Analysis Exploratory Analysis: Network visualization Visualization is a tool, but networks are complex and our visualization tools can sometimes confound. The strong advantage is that you get a complete overview of multiple features at once. The difficulty comes with trying to map a complex multi-dimensional object in low-dimensional space.
Complete Network Analysis Network Connections “Goods” flow through networks:
Complete Network Analysis Network Connections • We often care about networks because of how “goods” travel through the network. • In addition to the simple pairwise probability that one actor passes information on to another (pij), two factors affect flow through a network: • Topology • the shape, or form, of the network • - Example: one actor cannot pass information to another unless they are either directly or indirectly connected • Time • - the timing of contact matters • - Example: an actor cannot pass information he has not receive yet
Complete Network Analysis Network Connections: Topology Two features of the network’s topology are known to be important: connectivity and centrality • Connectivity refers to how actors in one part of the network are connected to actors in another part of the network. • Reachability: Is it possible for actor i to reach actor j? This can only be true if there is a chain of contact from one actor to another. • Distance: Given they can be reached, how many steps are they from each other? • Number of paths: How many different paths connect each pair?
Complete Network Analysis Network Connections: Topology Without full network data, you can’t distinguish actors with limited flow potential from those more deeply embedded in a setting. c b a
b f c e d Complete Network Analysis Network Connections: Connectivity Indirect connections are what make networks systems. One actor can reach another if there is a path in the graph connecting them. a b d a c e f Paths can be directed, leading to a distinction between strong and weak components
Complete Network Analysis Network Connections: Connectivity Reachability If you can trace a sequence of relations from one actor to another, then the two are reachable. If there is at least one path connecting every pair of actors in the graph, the graph is connected and is called a component. Intuitively, a component is the set of people who are all connected by a chain of relations.
Complete Network Analysis Network Connections: Connectivity This example contains many components.
Complete Network Analysis Network Connections: Connectivity • Because relations can be directed or undirected, components come in two flavors: • For a graph with any directed edges, there are two types of components: • Strong components consist of the set(s) of all nodes that are mutually reachable • Weak components consist of the set(s) of all nodes where at least one node can reach the other.
Complete Network Analysis Network Connections: Connectivity There are only 2 strong components with more than 1 person in this network. Components are the minimum requirement for social groups. As we will see later, they are necessary but not sufficient All of the major network analysis software identifies strong and weak components
Complete Network Analysis Network Connections: Connectivity • We can extend our conception of component to increase the structural cohesion of the definition. • Multiple connectivity: • Two paths with the same start and end point, but that have no other nodes in common are called node independent. • In every component, the paths linking actors i and j must pass through a set of nodes, S, that if removed would disconnect the graph. • The number of nodes in the smallest S is equal to the number of independent paths connecting i and j.
2 1 3 4 5 7 6 8 Complete Network Analysis Network Connections: Connectivity Simple component Every path from 1 to 8 must go through 4. S(1,8) = 4, and N(1,8)=1. That is, the graph is a component.
2 1 3 4 5 7 6 8 Complete Network Analysis Network Connections: Connectivity In this graph, there are multiple paths connecting nodes 1 and 8. Multiple connectivity 1 But only 2 of them are independent. 5 2 4 3 8 1 1 6 6 2 5 4 7 7 3 8 6 5 8 8 N(1,8) = 2. 7 8 8
Complete Network Analysis Network Connections: Connectivity A bicomponent is the set of all nodes connected by at least 2 node-independent paths.
2 1 3 4 5 7 6 8 Complete Network Analysis Network Connections: Connectivity Bicomponents can overlap by at most 1 person. These nodes are cutpoints in the graph. If that node is removed, the graph would be disconnected. 1 4 is a cutpoint 1 is a cutpoint
Complete Network Analysis Network Connections: Distance Geodesic distance is measured by the smallest (weighted) number of relations separating a pair: Actor “a” is: 1 step from 4 2 steps from 5 3 steps from 4 4 steps from 3 5 steps from 1 a
1.2 1 10 paths 0.8 5 paths probability 0.6 2 paths 0.4 1 path 0.2 0 2 3 4 5 6 Path distance Complete Network Analysis Network Connections: Distance Probability of transfer by distance and number of paths, assume a constant pij of 0.6
Complete Network Analysis Network Connections: Distance • High-risk actors over 4 years • 695 people represented • Longest path is 17 steps • Average distance is about 5 steps • Average person is within 3 steps of 75 other people • 137 people connected through 2 independent paths, core of 30 people connected through 4 independent paths Reachability in Colorado Springs (Sexual contact only) (Node size = log of degree)
X3 0 4 0 2 2 4 4 0 6 1 1 0 0 6 2 5 5 6 2 1 5 2 3 1 2 1 5 3 2 1 4 0 6 1 1 0 X 0 1 0 0 0 1 1 0 1 0 0 0 0 1 0 1 1 1 0 0 1 0 1 0 0 0 1 1 0 0 1 0 1 0 0 0 X2 2 0 2 0 0 0 0 2 0 1 1 2 2 0 4 1 1 0 0 1 1 2 1 1 0 1 1 1 2 1 0 2 0 1 1 2 e d Distance . 1 2 0 0 1 1 . 1 2 2 2 2 1 . 1 1 1 0 2 1 . 1 2 0 2 1 1 . 2 1 2 1 2 2 . Distance . 1 2 3 3 1 1 . 1 2 2 2 2 1 . 1 1 1 3 2 1 . 1 2 3 2 1 1 . 2 1 2 1 2 2 . c f b a Complete Network Analysis Network Connections: Distance Calculating distance in global networks: Powers of the adjacency matrix Calculate reachability through matrix multiplication. (see p.162 of W&F)
Complete Network Analysis Network Connections: Distance Calculating distance in global networks: Breadth-First Search In large networks, matrix multiplication is just too slow. A breadth-first search algorithm works by walking through the graph, reaching all nodes from a particular start node. Distance is calculated directly in most SNA software packages.
Complete Network Analysis Network Connections: Distance As a graph statistic, the distribution of distance can tell you a good deal about how close people are to each other (we’ll see this more fully when we get to closeness centrality). The diameter of a graph is the longest geodesic, giving the maximum distance. We often use the l, or the mean distance between every pair to characterize the entire graph. For example, all else equal, we would expect rumors to travel faster through settings where the average distance is small.
Complete Network Analysis Network Connections: Distance
Complete Network Analysis Network Connections: Distance
Complete Network Analysis Network Connections: Distance Travers and Milgram’s work on the small world is responsible for the standard belief that “everyone is connected by a chain of about 6 steps.” Two questions: Given what we know about networks, what is the longest path (defined by handshakes) that separates any two people? Is 6 steps a long distance or a short distance?
a k m b l j i e c f d h g Complete Network Analysis Network Connections: Distance When the graph is directed, distance is also directed (distance to vs distance from), following the direction of the tie. a b c d e f g h i j k l m ------------------------------------------ a. . 1 2 . . . . . . . . 2 1 b. 3 . 1 . . . . . . . . 1 2 c. . . . . . . . . . . . . . d. 4 3 1 . 1 2 1 . 2 . . 2 3 e. 3 2 2 1 . 1 2 . 1 . . 1 2 f. 4 3 3 2 1 . 3 . 2 . . 2 3 g. 5 4 4 3 2 1 . . 3 . . 3 4 h. . . . . . . . . 1 . . . . i. . . . . . . . . . . . . . j. . . . . . . . . 1 . . . . k. . . . . . . . . 1 . . . . l. 2 1 2 . . . . . . . . . 1 m. 1 2 3 . . . . . . . . 1 .
What if everyone maximized structural holes? Associates do not know each other: Results in an exponential growth curve. Reach entire planet quickly. Complete Network Analysis Network Connections: Distance
What if people know each other randomly?: Random graph theory shows that we could reach people quite quickly if ties were random Complete Network Analysis Network Connections: Distance
Complete Network Analysis Network Connections: Distance Random Reachability: By number of close friends 100% Degree = 4 Degree = 3 80% Degree = 2 60% Percent Contacted 40% 20% 0 0 1 2 3 4 5 6 7 8 9 10 11 12 13 14 15 Remove
Complete Network Analysis Network Connections: Distance Distance-Reach Distribution for a large Jr. High School (Add Health data) Random graph Observed
Complete Network Analysis Network Connections: Distance Milgram’s test: Send a packet from sets of randomly selected people to a stockbroker in Boston. Experimental Setup: Arbitrarily select people from 3 pools: a) People in Boston b) Random in Nebraska c) Stockholders in Nebraska
Complete Network Analysis Network Connections: Distance Milgram’s Findings: Distance to target person, by sending group.
Complete Network Analysis Network Connections: Distance Most chains found their way through a small number of intermediaries. Understanding why this is true has been called the “Small-World Problem,” which has since been generalized to a much more formal understanding of tie patterns in large networks (see below) For purposes of flow through graphs, distance is a primary concern so long as pij < 1. Most measures of position in a network account for some aspect of distance.
Complete Network Analysis Network Connections: Centrality • Distance measures “locate” a node by number of steps that separate them from the remainder of the network, but there are many other ways of locating nodes in networks. • Centrality refers to (one dimension of) location, identifying where an actor resides in a network. • For example, we can compare actors at the edge of the network to actors at the center. • In general, this is a way to formalize intuitive notions about the distinction between insiders and outsiders. • As a terminology point, some authors distinguish centrality from prestige based on the directionality of the tie. Since the formulas are the same in every other respect, I stick with “centrality” for simplicity.
Complete Network Analysis Network Connections: Centrality • Conceptually, centrality is fairly straight forward: we want to identify which nodes are in the ‘center’ of the network. In practice, identifying exactly what we mean by ‘center’ is somewhat complicated, but substantively we often have reason to believe that people at the center are very important. • The standard centrality measures capture a wide range of “importance” in a network: • Degree • Closeness • Betweenness • Eigenvector / Power measures • After discussing these, I will describe measures that combine features of each of them.
Complete Network Analysis Network Connections: Centrality The most intuitive notion of centrality focuses on degree. Degree is the number of direct contacts a person has. The ideas is that the actor with the most ties is the most important:
Complete Network Analysis Network Connections: Centrality In a simple random graph (Gn,p), degree will have a Poisson distribution, and the nodes with high degree are likely to be at the intuitive center. Deviations from a Poisson distribution suggest non-random processes, which is at the heart of current “scale-free” work on networks (see below).
Complete Network Analysis Network Connections: Centrality Degree centrality, however, can be deceiving, because it is a purely local measure.
Complete Network Analysis Network Connections: Centrality If we want to measure the degree to which the graph as a whole is centralized, we look at the dispersion of centrality: Simple: variance of the individual centrality scores. Or, using Freeman’s general formula for centralization (which ranges from 0 to 1): UCINET, SPAN, PAJEK and most other network software will calculate these measures.
Complete Network Analysis Network Connections: Centrality Degree Centralization Scores Freeman: 0.0 Variance: 0.0 Freeman: 1.0 Variance: 3.9 Freeman: .02 Variance: .17 Freeman: .07 Variance: .20
Complete Network Analysis Network Connections: Centrality A second measure of centrality is closeness centrality. An actor is considered important if he/she is relatively close to all other actors. Closeness is based on the inverse of the distance of each actor to every other actor in the network. Closeness Centrality: Normalized Closeness Centrality