Download
1 / 13
130 likes | 286 Views
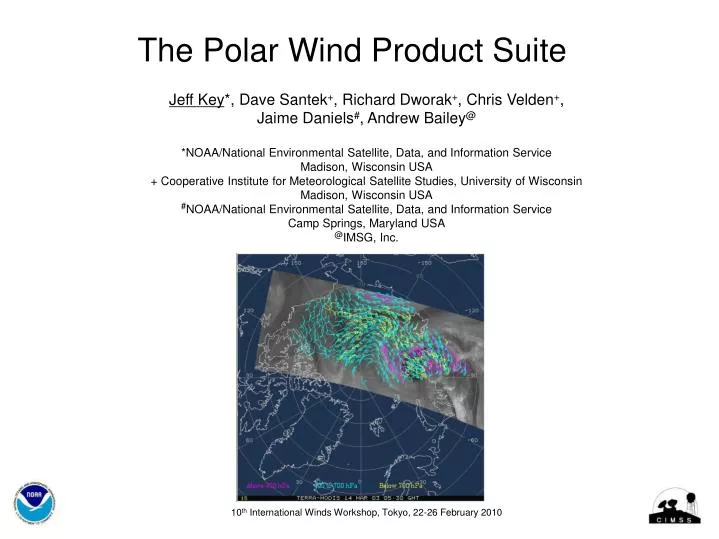
The Polar Wind Product Suite. Jeff Key *, Dave Santek + , Richard Dworak + , Chris Velden + , Jaime Daniels # , Andrew Bailey @ *NOAA/National Environmental Satellite, Data, and Information Service Madison, Wisconsin USA

E N D
The Polar Wind Product Suite Jeff Key*, Dave Santek+, Richard Dworak+, Chris Velden+, Jaime Daniels#, Andrew Bailey@ *NOAA/National Environmental Satellite, Data, and Information ServiceMadison, Wisconsin USA + Cooperative Institute for Meteorological Satellite Studies, University of WisconsinMadison, Wisconsin USA #NOAA/National Environmental Satellite, Data, and Information ServiceCamp Springs, Maryland USA @IMSG, Inc. 10th International Winds Workshop, Tokyo, 22-26 February 2010
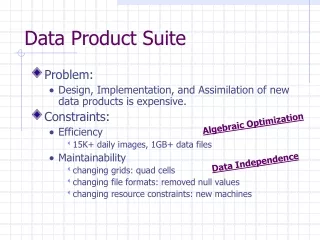
The Polar Wind Product Suite Operational MODIS Polar Winds • Aqua and Terra separately, bent pipe data source • Aqua and Terra combined, bent pipe • Direct broadcast (DB) at • McMurdo, Antarctica (Terra and Aqua separately) • Tromsø, Norway, antenna on Svalbard (Terra only) • Sodankylä, Finland (Terra only) • Fairbanks, Alaska (Terra, from UAF, is reliable; Aqua is not) EW AVHRR Polar Winds • Global Area Coverage (GAC) for NOAA-15, -16, -17, -18, -19 • Metop • HRPT (High Resolution Picture Transmission = direct readout) at • Barrow, Alaska, NOAA-16, -17, -18, -19 • Rothera, Antarctica, NOAA-17, -18, -19 • Historical GAC winds, 1982-2009. Two satellites throughout most of the time series. Operational Operational
Polar Wind Product History 10-day MODIS winds case study made available Real-time Aqua MODIS winds Real-time AVHRR winds MODIS DB winds at Fairbanks Real-time Terra MODIS winds Mixed-satellite MODIS winds MODIS DB winds at McMurdo Metop AVHRR winds 2001 2002 2003 2004 2005 2006 2007 2008 2009 AVHRR HRPT winds from Rothera Daily AVHRR winds MODIS DB winds at Sodankylä NESDIS MODIS winds on GTS MODIS DB winds at Tromsø ECMWF and NASA DAO demonstrate positive impact AVHRR HRPT winds from Barrow Terra MODIS winds in ECMWF operational system DB winds distributed via EUMETCast
MODIS Winds: Single Satellite • Aqua and Terra winds are generated separately • Data from the NOAA Real-Time System (aka “bent pipe”), composites of two or three 5-min granules. • 1 km MODIS product (MOD021KM) is remapped to 2 km • Cloud-track and water vapor winds • NCEP’s GFS is used as the background • Pros: Complete polar coverage • Cons: Some MODIS granules arrive (very) late
AVHRR GAC and Metop Winds • Six satellites: NOAA-15, -16, -17, -18, -19, and Metop • 4 km for GAC; 2 km for Metop • Cloud-track winds • NCEP’s GFS is used as the background. NOAA-19 • Pros: Complete polar coverage; excellent temporal sampling with all satellites. Good preparation for NPOESS VIIRS. • Cons: No water vapor clear winds (no clear sky). Lower spatial resolution (GAC) yields fewer vectors. Height assignment uncertainty for thin clouds. Metop
MODIS Polar Winds 24-hr Loop Routine production of MODIS winds began in 2002
AVHRR Polar Winds AVHRR winds are being generated with historical AVHRR (1982-2002) and in real-time. Yellow: Below 700 hPa Light Blue: 400-700 hPa Magenta: Above 400 hPa NOAA-11 August 5, 1993 1800 UTC NOAA-14 August 14, 1995 2300 UTC
Direct Broadcast Sites for Polar Winds and Other Products Fairbanks (Terra MODIS) Barrow (HRPT AVHRR) Rothera (HRPT AVHRR) Tromsø/Svalbard (Terra MODIS) McMurdo (Terra/Aqua MODIS) Sodankylä (Terra MODIS) McMurdo Barrow Fairbanks Svalbard Rothera Sodankylä
Historical AVHRR Polar Winds • 1982 - 2009 • Generally two satellites at any given time, NOAA-7 through -19 • Global Area Coverage (GAC) data gridded at 5 km. • Cloud-track winds using IR channel only (no water vapor channel). • NCEP Reanalysis is background. • Pros: An essential product for reanalysis projects. • Cons: Low resolution. Height assignment uncertainty for thin clouds.
Current Operational Users: • European Centre for Medium-Range Weather Forecasts (ECMWF) - since Jan 2003. Testing DB winds. • NASA Global Modeling and Assimilation Office (GMAO) - since early 2003. • Deutscher Wetterdienst (DWD) – since Nov 2003. Testing DB winds. • Japan Meteorological Agency (JMA), Arctic only - since May 2004. Testing DB winds. • Canadian Meteorological Centre (CMC) – since Sept 2004. • US Navy, Fleet Numerical Meteorology and Oceanography Center (FNMOC) –since Oct 2004. DB winds since Apr 2006. AVHRR GAC and MetOp since Nov 2007. • UK Met Office – since Feb 2005. DB winds (experimentally) since Jun 2006. AVHRR GAC since . • National Centers for Environmental Prediction (NCEP) and the Joint Center for Satellite Data Assimilation - since Nov 2005. • MeteoFrance - since Jun 2006. MODIS, AVHRR, and all DB winds. • National Center for Atmospheric Research (NCAR), Antarctic Mesoscale Model (AMPS) – since Oct 2006. DB winds (McMurdo) • Australian Bureau of Meteorology - since Sept (?) 2007 • Hydrological and Meteorological Centre of Russia (Hydrometcenter) – since mid-2010. DB winds. MODIS Winds in NWP
Model impact studies have shown that the polar winds have a positive impact on weather forecasts not just in the polar regions, but globally. Figure: Anomaly correlations as a function of forecast range for the 500 hPa geopotential over the Northern Hemisphere extratropics (north of 20 degrees latitude). The study period is 5-29 March 2001. Including the MODIS winds in the model (red line) extends the 5-day forecast at a given accuracy by 3-6 hrs. (Figure courtesy of ECMWF) Forecast scores (anomaly correlations) are the correlation between the forecast geopotential height anomalies, with and without the MODIS winds, and their own analyses. From ECMWF
Forecast Busts (NASA GMAO) While the overall impact of the MODIS winds is positive, the impact at any given time may be positive, negative (occasionally), or neutral. What’s important, however, is that the MODIS winds significantly reduce the likelihood and magnitude of forecast “busts”, as shown below in time series of anomaly correlations. Southern Hemisphere Extratropics Arctic Blue is forecast with MODIS winds; red is control run
Impact in Tropics: GFS Model The Joint Center for Satellite Data Assimilation found that MODIS winds also impact hurricane track forecasts. Average hurricane track errors (nm) Frequency of superior hurricane performance In both tables, the forecast time is the bottom row. The control run (Cntrl) did not assimilate the MODIS winds. Percent of cases where the specified run had a more accurate hurricane position than the other run. Note: These cases are for hurricanes in the subtropics during 2004.