Download
1 / 17
170 likes | 346 Views
3 nd Meeting Chemical Analysis. Steps and issues. STEPS IN CHEMICAL ANALYSIS. Sampling Preparation Testing/Measurement Data analysis 2. Error in chemical analysis 3. Statistics for chemistry. SAMPLING. Prerequisite: sample should be representative Example: Main sample.

E N D
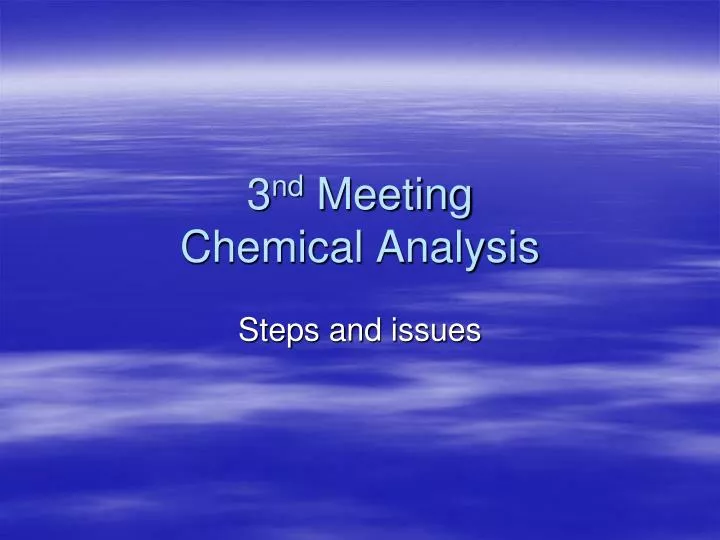
3ndMeetingChemical Analysis Steps and issues
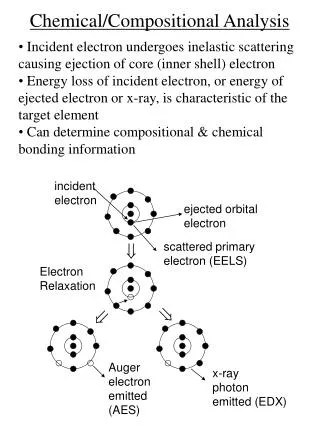
STEPS IN CHEMICAL ANALYSIS • Sampling • Preparation • Testing/Measurement • Data analysis 2. Error in chemical analysis 3. Statistics for chemistry
SAMPLING Prerequisite: sample should be representative Example: Main sample Primary sample C A B 1 2 Bulk sample 4 3 a b a Sub-bulk sample b c d c d 2 + 3 Lab sample 1 + 4
Preparation for Solid Sample • Wet Digesting • Direct solvation with water • Solvation with: oxydator acids (HNO3, H2SO4, HCl, HClO4, its mixtures) and base. • Destruction with aqua regia: HNO3 : HCl = 1 : 3. 2. Dry digesting Ashing (Furnace) in certain temperature (+“ashing aid”. if necessary), solving in acids, and diluting quantitatively
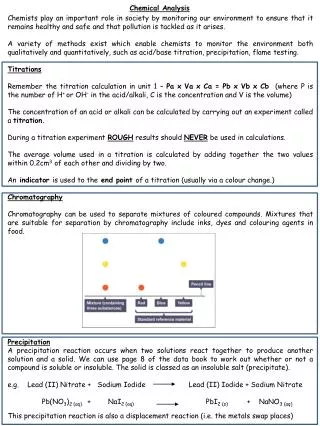
TESTING/MEASUREMENT Purpose : Qualitative and quantitative analysis Qualitative Analysis: Spot test Analysis Quantitative Analysis: Conventional Methods: Volumetri dan Gravimetri Physico-chemical methods (modern) : Elektrokimia, Spektrofotometri
Calculatioan and Data Interpretation • DATA CAN BE ACHIEVED (quantitative analysis): • volume, (volumetric), • mass, (Gravimetric) • Absorption (Spectrometric) • Potential Cell (Electrochem) Should be changed in to Concentration, (M, ppm) content (% mass/mass , % vol/mass)
Error in data interpretation Every steps in analysis steps always face error. Need Statistic calculation to help in decision making
Error in chemical analysis • Indeterminate Error error can be exactly defined • Examples: • - Noise and deviation in electronic circuits • - Vibration of building • - environment change • 2. Determinate Error/Systematical error • - Error in methods: Interfere agents ( can be + or -) • 3. Operational Error: Operators/Analysts • 4. Instrumental Error: Uncalibated/ un-standardized instruments
Relative Error True value – measurement value % Error = x 100% True value
Simple Statistics in chemical analysis 1. Mean (harga rata-rata, x ), x1 + x2 + x3 + ... + xn X = n • Standard Deviation (S), Variability of analysis result • ( x – x )2 • S = • n – 1 • JK • S = • n - 1
Relative Standard Deviation (R.S.D) • s • R.S.D = • x • Coefficient of Variation (C.V.) • s x 100 • C.V. = • x Example : Analysis of iron ores produce % mass of Iron: 7,08 ; 7,21 ; 7,12 ; 7,09 ; 7,16 ; 7,14 ; 7,07 ; 7,14 ; 7,18 ; 7,11. Calculate: means, Standard of deviation, and coefficient of variation ! Jawab : X = 7,13 % ; s = 0,045 % ; C.V. = 0,63%
Batas Kepercayaan, merupakan daerah di sekitar harga yang sesungguhnya • = x + t (sx) • s • sx = • n • Nilai t diperoleh dari Tabel t pada derajat kebebasan (D.B.) = n - 1 Contoh: Hasil analisis massa nikel (mg) yang terkandung dalam 1 g suatu bahan galian adalah : 5,0 ; 5,3 ; 5,7 ; 4,8 ; 5,2 Hitung batas kepercayaan pada tingkat kepercayaan 95%
ANSWER x = 5,2 ; s = 0,3 ; sx = 0,134 = 5,20 + 0,37 So 95% believe that % mass of Iron is between : 4,83 – 5,57.
Presision • The similarity of value/data in one set of data, shown by standard of deviation • 9. Acuration • The nearness of data measurement to the true value
X X X X X x x xx x x x xx x X X X X X B C D A
X X X X X x x xx x x x xx x X X X X X B C D A Keterangan: A : Presisi baik, akurasi baik B : Presisi baik, akurasi tidak baik C : Presisi tidak baik, akurasi baik (rata-rata) D : Presisi tidak baik, akurasi tidak baik
SEKIAN DULU Terima Kasih