Download

1 / 16
190 likes | 397 Views
Least Squares using MatLab. Adam Q. Colley EMIS8381 March 31, 2012. Least Squares Overview. One Dependent Variable One or more (n) Independent Variables (Independent to the Dependent Variable) More data points than number of Variables Find one equation with least amount of error.

E N D
Least Squares using MatLab Adam Q. Colley EMIS8381 March 31, 2012
Least Squares Overview • One Dependent Variable • One or more (n) Independent Variables • (Independent to the Dependent Variable) • More data points than number of Variables • Find one equation with least amount of error
How Least Squares Works • Find coefficients for Independent Variables • Find constant (coefficient for x0 = 1) • Final equation is y = Σ (ai*xi) {i = 0, 1, …, n} • n+1 equations are created by multiplying each data point by xi and summing • Solve n+1 equations for n+1 unknown values
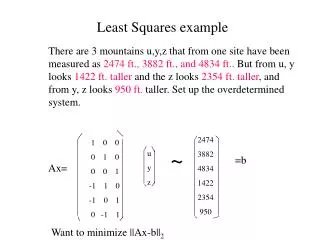
Example (Calculated Data) Σ Equations: 2464 = 5a0 + 37a1 + 333a2 25094 = 37a0 + 333a1 + 3421a2 279120 = 333a0 + 3421a1 + 38229a2 Solution: a0 = 8.777 a1 = 1.979 a2 = 7.048 Equation: y = 1.979x1 + 7.048x2 + 8.777
Least Squares Matrix • Raw Data: • y Rm • X Rm,n • Calculated Data: (A . a = b => a = A-1. b) • C = [ Îm | X ] Rm,n+1 • D = [ C | y ] Rm,n+2 • T = CT. D Rn+1,n+2 • b = T:,n+2 Rn+1 • A = T:,1:n+1 Rn+1,n+1 • a = A-1. b Rn+1
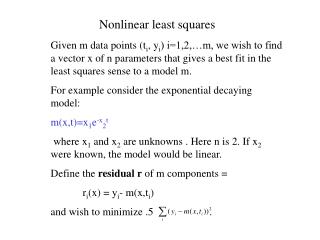
Non-Linear Least Squares • Least Squares Method: • Data values are known • Finds new linear function based on known values • Minimizes error of new function to known values • What If: • Needed to find function • Function is non-linear
Non-Linear Example • Example: y = a*f(x, b) + c • f(x, b) = ebx • Least Squares will find values for a and c
Given Known Values • Given LS(b) is the covariant using b in f(x, b) • LS(b) >= 0 • LS(b) is usually quasi-convex or better • Example exception: sin(bx) • LS(b) has no constraints • Objective: Minimize LS(b)
Finding Unknown Values • Use a search method on LS(b):
Example Search (Fibonacci) • ba = 3.5, bb = 4.5, l = 0.1, n = 6
Example Analysis • b = 3.96 • LS(b) = 56.29 • R2 = 0.9997 • y = 5.1837e3.96x – 3.0567 • Excel suggests: y = 3.8907e4.2607x + 0 • Covariance = 118.68, R2 = 0.9972
In MatLab • Steps: • Modify X matrix using search value for b • Use the same LS function • Use Coefficient to find Ŷ values • Subtract Y from Ŷ, square, and sum • Use summation for deciding next search step