Download
1 / 11
210 likes | 708 Views
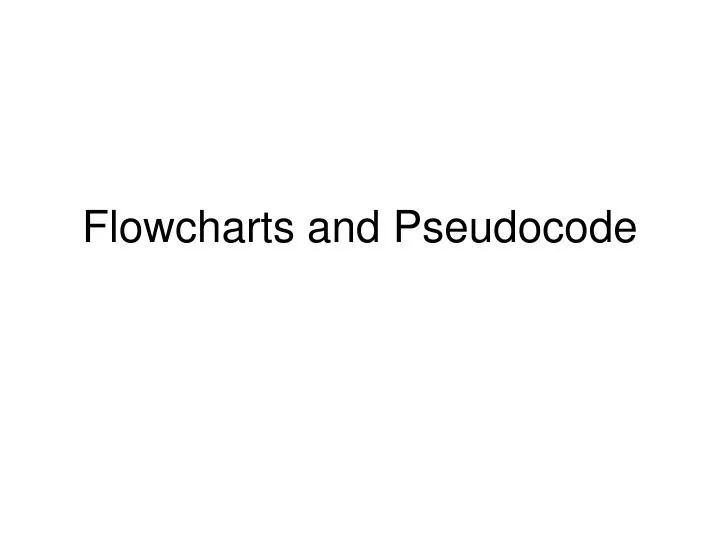
Flowcharts and Pseudocode. Flowchart. represent the algorithm graphically flow of the process indicated with arrows that connecting the symbols

E N D
Flowchart • represent the algorithm graphically • flow of the process indicated with arrowsthat connecting the symbols • shown with symbolic shapes-lozenge represent start and -arrow represent the direction of the steps-rectangle represent working process-parallelogram represent input or output-rhombus represent of decision
Pseudocode • represent the algorithm by text narratively • Omits some complexprogramming code • help people to understand the algorithm in a easilyway
Example of Flowcharts and Pseudocode • A program to calculate the total number and average of the selling of mobile phone for a week from Monday to sunday • Draw a flowchart and pseudocode to show the algorithm
Pseudocode: 10 Input Mon,Tue,Wed,Thu,Fri,Sat Start Input Mon, Tue, Wed, Thu ,Fri, Sat
Pseudocode: 20 Total=Mon+Tue+Wed+Thu+Fri+Sat Start Input Mon, Tue, Wed, Thu ,Fri, Sat Total=Mon+Tue+Wed+ Thu+Fri+Sat
Pseudocode: 30 Average = Total /6 Start Input Mon, Tue, Wed, Thu ,Fri, Sat Total=Mon+Tue+Wed+ Thu+Fri+Sat Average=Total/6
Pseudocode: 40 Average = Output Total ,Average Start Input Mon, Tue, Wed, Thu ,Fri, Sat Total=Mon+Tue+Wed+ Thu+Fri+Sat Average=Total/6 Output Total,Average
Pseudocode: 10 Input Mon,Tue,Wed,Thu,Fri,Sat 20 Total=Mon+Tue+Wed+Thu+Fri+Sat 30 Average = Total /6 40 Average = Output Total ,Average Start Input Mon, Tue, Wed, Thu ,Fri, Sat Total=Mon+Tue+Wed+ Thu+Fri+Sat Average=Total/6 Output Total,Average End
Advantage-get the structure of the algorithm clearly -reduce the errors when processing the algorithm Disadvantage-need time to preparea complete flowchart -not suitable for showing complex algorithm Advantage and disadvantage of Flowcharts
Advantage-beginner of computer users to understand the algorithm easily-no restrictions on programming syntax -better readability Disadvantage-need time to preparea complete flowchart Advantage and disadvantage of the Pseudocode