Download
1 / 1
10 likes | 88 Views
Profitability of Cotton Production in the Texas High Plains from 1996 to 2005 Ginger Sides, Phillip Johnson, and Darcie Schmidt-Wertz Department of Agricultural and Applied Economics Texas Tech University. Objective.

E N D
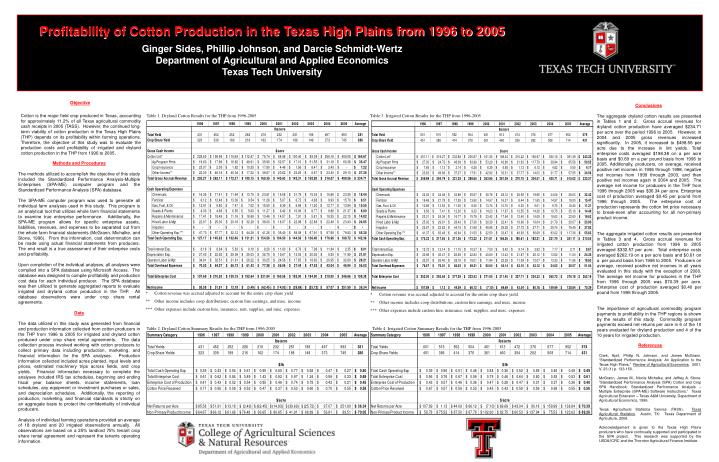
Profitability of Cotton Production in the Texas High Plains from 1996 to 2005 Ginger Sides, Phillip Johnson, and Darcie Schmidt-Wertz Department of Agricultural and Applied Economics Texas Tech University Objective Cotton is the major field crop produced in Texas, accounting for approximately 11.2% of all Texas agricultural commodity cash receipts in 2005 (TASS). However, the continued long-term viability of cotton production in the Texas High Plains (THP) depends on its profitability within farming operations. Therefore, the objective of this study was to evaluate the production costs and profitability of irrigated and dryland cotton production in the THP from 1996 to 2005. Conclusions The aggregate dryland cotton results are presented in Tables 1 and 2. Gross accrual revenues for dryland cotton production have averaged $234.71 per acre over the period 1996 to 2005. However, in 2004 and 2005 gross revenues increased significantly. In 2005, it increased to $498.56 per acre due to the increase in lint yields. Total enterprise costs averaged $198.38 on a per acre basis and $0.69 on a per pound basis from 1996 to 2005. Additionally, producers, on average, received positive net incomes in 1996 through 1998, negative net incomes from 1999 through 2003, and then positive net incomes again in 2004 and 2005. The average net income for producers in the THP from 1996 through 2005 was $36.34 per acre. Enterprise cost of production averaged $0.45 per pound from 1996 through 2005. The enterprise cost of production represents the cotton lint price necessary to break-even after accounting for all non-primary product income. The aggregate irrigated cotton results are presented in Tables 3 and 4. Gross accrual revenues for irrigated cotton production from 1996 to 2005 averaged $332.57 per acre. Total enterprise costs averaged $262.19 on a per acre basis and $0.61 on a per pound basis from 1996 to 2005. Producers on average, received positive net incomes in all years evaluated in this study with the exception of 2000. The average net income for producers in the THP from 1996 through 2005 was $70.39 per acre. Enterprise cost of production averaged $0.40 per pound from 1996 through 2005. The importance of agricultural commodity program payments to profitability in the THP regions is shown by the results of this study. Commodity program payments exceed net returns per acre in 6 of the 10 years evaluated for dryland production and 4 of the 10 years for irrigated production. Table 1. Dryland Cotton Results for the THP from 1996-2005 Table 3. Irrigated Cotton Results for the THP from 1996-2005 Methods and Procedures The methods utilized to accomplish the objective of this study included the Standardized Performance Analysis-Multiple Enterprises (SPA-ME) computer program and the Standardized Performance Analysis (SPA) database. The SPA-ME computer program was used to generate all individual farm analyses used in this study. This program is an analytical tool that utilizes whole farm financial statements to examine true enterprise performance. Additionally, the SPA-ME program allows for specific enterprise assets, liabilities, revenues, and expenses to be separated out from the whole farm financial statements (McGrann, Michalke, and Stone, 1996). From this information, cost determination can be made using actual financial statements from producers. The end result is a true assessment of their enterprise costs and profitability. Upon completion of the individual analyses, all analyses were compiled into a SPA database using Microsoft Access. The database was designed to compile profitability and production cost data for each individual producer. The SPA database was then utilized to generate aggregated reports to evaluate irrigated and dryland cotton production in the THP. All database observations were under crop share rental agreements. Data The data utilized in this study was generated from financial and production information collected from cotton producers in the THP from 1996 to 2005 for irrigated and dryland cotton produced under crop share rental agreements. The data collection process involved working with cotton producers to collect primary data including production, marketing, and financial information for the SPA analyses. Production information collected included acres planted, input levels and prices, estimated machinery trips across fields, and crop yields. Financial information necessary to complete the analyses included IRS tax schedules, beginning and ending fiscal year balance sheets, income statements, loan schedules, any equipment or investment purchases or sales, and depreciation schedules. Additionally, the reporting of production, marketing, and financial standards is strictly on an aggregate basis to protect the confidentiality of individual producers. Analysis of individual farming operations provided an average of 18 dryland and 20 irrigated observations annually. All observations are based on a 25% landlord 75% tenant crop share rental agreement and represent the tenants operating information. * Cotton revenue was accrual adjusted to account for the entire crop share yield ** Other income includes coop distributions, custom hire earnings, and misc. income *** Other expenses include custom hire, insurance, rent, supplies, and misc. expenses * Cotton revenue was accrual adjusted to account for the entire crop share yield ** Other income includes coop distributions, custom hire earnings, and misc. income *** Other expenses include custom hire, insurance, rent, supplies, and misc. expenses Table 2. Dryland Cotton Summary Results for the THP from 1996-2005 Table 4. Irrigated Cotton Summary Results for the THP from 1996-2005 References Clark, April, Phillip N. Johnson, and James McGrann. “Standardized Performance Analysis: An Application to the Texas High Plains.” Review of Agricultural Economics. 2001. V. 23 (1) p. 133-150. McGrann, James M., Nicole Michalke, and Jeffrey A. Stone. “Standardized Performance Analysis (SPA) Cotton and Crop SPA Handbook: Standardized Performance Analysis – Multiple Enterprise (SPA-ME) Software Instructions.” Texas Agricultural Extension – Texas A&M University, Department of Agricultural Economics, 1996. Texas Agricultural Statistics Service (TASS). Texas Agricultural Statistics. Austin, TX: Texas Department of Agriculture, 2006. Acknowledgement is given to the Texas High Plains producers who have continually supported and participated in the SPA project. This research was supported by the USDA/ICRC and the Thornton Agricultural Finance Institute.