Download
1 / 39
400 likes | 408 Views
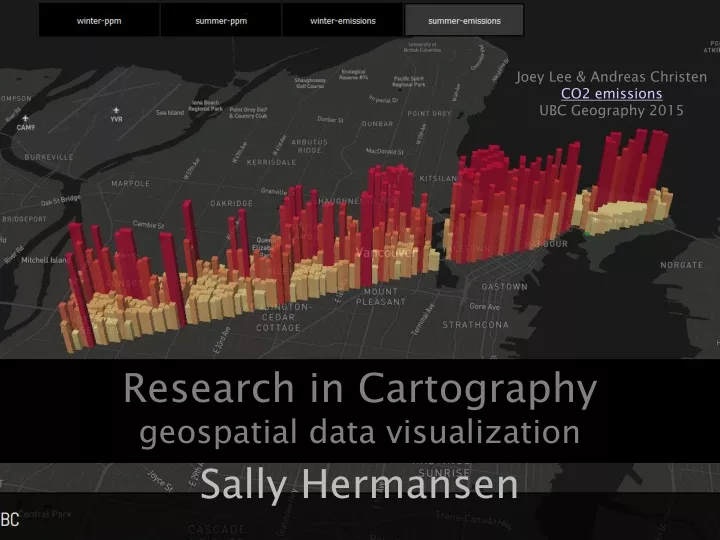
Joey Lee & Andreas Christen CO2 emissions UBC Geography 2015. Research in Cartography geospatial data visualization Sally Hermansen. What are we going to do today. Get us thinking about geospatial data vis – some cool web sites

E N D
Joey Lee & Andreas Christen CO2 emissions UBC Geography 2015 Research in Cartographygeospatial data visualization Sally Hermansen
What are we going to do today • Get us thinking about geospatial data vis – some cool web sites • Review cartographic communication as you have been exposed to in 270/372 • From Cartography to Geospatial data Visualization: • Process • Tufte’s principles of visualization • Digital Transition • Politics • Review the course: web site; weekly schedule; assessment • Assignment 1
1. Get us thinking about geospatial data vis – some cool web sites • New York Times: Irma maps Monday Sept 11/17 • https://www.nytimes.com/interactive/2017/09/05/us/hurricane-irma-map.html?_r=1&emc=edit_nn_20170911&nl=morning-briefing&nlid=80589880&te=1
What are we going to do today • Get us thinking about geospatial data vis – some cool web sites • Review cartographic communication as you have been exposed to in 270/372 • From Cartography to Geospatial data Visualization: • Process • Tufte’s principles of visualization • Digital Transition • Politics • Review the course: web site; weekly schedule; assessment • Assignment 1
2. Cartographic Communication System 360.here.com real world map user GIS analyst/ cartographer’s conception of the real world map map DECODING 472 ENCODING 270/372 visual noise
Map Design (270/372) • Acquire data: check, review, edit, filter, parse • Classify, analyze, mine data: best method • Represent data: • map elements - symbology • figure/ground - balance • Ethics, audience, visual noise
What are we going to do today • Get us thinking about geospatial data vis – some cool web sites • Review cartographic communication as you have been exposed to in 270/372 • From Cartography to Geospatial data Visualization: • Process • Tufte’s principles of visualization • Digital Transition • Politics • Review the course: web site; weekly schedule; assessment • Assignment 1
3. From Cartography to Geospatial Data VisualizationLets get more creative… and this does not necessarily mean more complex • http://www.informationisbeautiful.net/visualizations/the-hollywood-insider/ • http://www.nytimes.com/interactive/2016/09/12/science/earth/ocean-warming-climate-change.html • MIT sensible cities lab http://senseable.mit.edu/
Geospatial Data Visualization Introduction to Dodge, McDerby and Turner Geographic Visualization • Looking: Explanation • Presentation graphics, maps, charts • Static, dynamic, animation, 3D • Querying Exploration • Visual interfaces for info access • Data mining • Questioning Exploration • Probe and drill down from presentation graphics • Interaction: change projections, filtering, classification, linked displays, real-time response • BBC Gapminder (4 minutes) http://www.gapminder.org/videos/200-years-that-changed-the-world-bbc/
a) Visualization ProcessIntroduction to Dodge, McDerby and Turner Geographic Visualization GOAL: helping people see the unseen • see complex relationships, • clear understanding of phenomenon, • reduce search time • reveal relationships • classics: London Tube and Minard’s Napoleon March map Theoretical Process: • Cognitive process of learning through the active engagement with graphical signs. • A cognitive shorthand for places and processes Technical Process…
b) Tufte’s Principles of Visualization • Visual Explanations • Envisioning Information • Beautiful Evidence
Goals of the Course = Goals of Tufte’s books: • Creativity in Envisioning Information • Representing knowledge with integrity through Visual Explanations • Leaving behind Beautiful Evidence
Envisioning InformationEscaping flatland image number word art
Visual Explanations Develop methods to: Describe Illustrate Construct Knowledge Clarity and Excellence in Thinking Clarity and Excellence in Data Display
The importance of Visual Explanations: cause and effect Decision to Launch Space Challenger • Jan. 28, 1986 • Perhaps Tufte’s greatest story • Page 38 VE
Tufte, BE, p 122-139Minard’s Map: analysis Tufte’s Principles: • Comparisons • Compared to what? 422 to 10 only 1 in 42 survived; 22,000 died in 2 days river • Causality, Mechanism, Structure, Explanation • Termperature (reaumur scale, like C) starts at 0 or freezing, and • Time: retreat Oct to Dec. 7th • Multivariate Analysis • 6 variables: size, location (x and y), direction, temp, date • Integration of Evidence: words, numbers, images, diagrams: mixed methods • Documentation : titles, authors, data source info, scales • Content counts: quality, relevance, integrity of content These principles are rooted in cognitive tasks – are relevant for Producing presentation and consuming presentations Analytical thinking: 1. causality 2. comparison 3. multivariate complexity
c) Digital TransitionIntroduction to Dodge, McDerby and Turner Geographic Visualization • Since 90s: rapid development and diffusion of information and communication • Mapquest, google maps, openstreetmap • Cheap, powerful computer graphics • Web mapping; on-line GIS tools, interactive mapping • Visualizations seen increasingly as transitory info resources, created at the moment and discarded after use
Huge change in geospatial data: • from UBC geography Getdata to • open data captured by governments and industry to • citizen science data or Volunteer Geographic Information • Big Data: sensors can now capture massive amounts of data in real time
Carlo RattiDirector MIT Sensible Cities lab Big data on cities + technology + design = Making cities smartergreenerhealthier
Carlo RattiDirector MIT Sensible Cities lab • http://senseable.mit.edu/livesingapore/visualizations.html • Underground project • MIT team: “economists, engineers, data scientists, biologists, mathematicians and data visualizers”
Carlo RattiDirector MIT Sensible Cities lab “he has figured out how to line up art and science, to merge a visual repertoire with one based on technology” AZUREMAGAZINE, Sept 2017
d) Politics of VisualizationIntroduction to Dodge, McDerby and Turner Geographic Visualization • Methodology of data selection design process • Subjective process: decision to include, exclude, represent, message • Data integrity – with all this open data, software, hackathons, github, forking…. We are losing meta data – data lineage and data integrity.
Data integrity? • https://zhang341.carto.com/viz/62f69b08-536d-11e6-b8f1-0e3ebc282e83/public_map • Versus • http://www.tampabay.com/projects/2015/investigations/pinellas-failure-factories/
What are we going to do today • Get us thinking about geospatial data vis – some cool web sites • Review cartographic communication as you have been exposed to in 270/372 • From Cartography to Geospatial data Visualization: • Process • Tufte’s principles of visualization • Digital Transition • Politics • Review the course: web site; weekly schedule; assessment • Assignment 1
4. The Course http://blogs.ubc.ca/advancedcartography/ http://vancitytrees.tumblr.com/ https://ubcwellbeing.wordpress.com/
Goals of Course • Understand geospatial data visualization process from raw data to interactive web maps (encoding information) • Understanding of decoding geospatial information displays: visual system, perception, cognition • Exposure to geospatial data visualization created with open source tools which may involve some coding. • Create a portfolio blog site as a repository of your work • Work with a community partner on a visualization project
5. Map Critique Assignment • Due at the beginning of next class • Presenters?