Download
1 / 85
850 likes | 856 Views
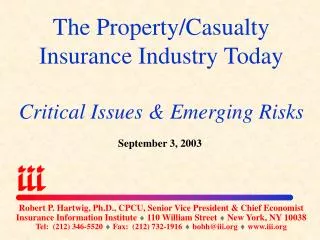
Overview & Outlook for the Property/Casualty Insurance Industry. July 2003. Robert P. Hartwig, Ph.D., CPCU, Senior Vice President & Chief Economist Insurance Information Institute 110 William Street New York, NY 10038

E N D
Overview & Outlook for the Property/CasualtyInsurance Industry July 2003 Robert P. Hartwig, Ph.D., CPCU, Senior Vice President & Chief Economist Insurance Information Institute 110 William Street New York, NY 10038 Tel: (212) 346-5520 Fax: (212) 732-1916 bobh@iii.org www.iii.org
Presentation Outline • Hard Market • Pricing & Affordability • P/C Profitability • Underwriting Performance • Investment Performance • Credit/C.L.U.E. • Tort Environment • Q & A
Strength of Recent Hard Markets by Real NWP Growth 1985-87 2001-03 1975-78 Real NWP Growth During Past 3 Hard Markets 1975-78: 8.6% 1985-87: 14.5% 2001-03F: 9.4% Note: Shaded areas denote hard market periods. Source: A.M. Best, Insurance Information Institute *2003 figure is estimate on first quarter result.
Council of Insurance Agents & Brokers Rate Survey First Quarter 2003 Rate Increases By Line of Business No Change Up 1-10% 10-20% 20-30% 30-50% 50%-100% >100% Comm. Auto 8% 23% 40% 19% 5% 0% 0% Workers Comp 7% 20% 35% 23% 7% 2% 0% General Liability 7% 23% 42% 20% 3% 0% 0% Comm. Umbrella 4% 12% 28% 27% 15% 8% 1% D&O 3% 6% 25% 28% 15% 8% 2% Comm. Property* 8% 24% 35% 17% 4% 0% 0% Construction Risk 7% 5% 27% 23% 16% 3% 0% Terrorism 13% 17% 19% 10% 2% 1% 1% Business Interr. 13% 33% 28% 7% 1% 0% 0% Surety Bonds 9% 14% 19% 10% 4% 0% 2% Med Mal 2% 2% 5% 8% 18% 14% 8% *9% of respondent reported a decline.
Cost of Risk per $1,000 of Revenues: 1990-2002E • Cost of risk to corporations fell 42% between 1992 and 2000 • Estimated 15% increase in 2001, 25% in 2002 Cost of risk is still less than it was a decade ago! Source: 2001 RIMS Benchmark Survey; Insurance Information Institute estimates.
*III Estimates; Estimates for 2001-2003 based on BLS CPI data for motor vehicle insurance. Source: NAIC, Insurance Information Institute Average Expenditures on Auto Insurance: US Countrywide auto insurance expenditures are expected to rise 9% in 2003, 6% in 2004
*III Estimates; Estimates for 2001-2003 based on BLS CPI data for tenants and household insurance. Source: NAIC, Insurance Information Institute Average Expenditures on Homeowners Insurance: US Average US HO expenditures are expected to rise by 7% in 2003, 8% in 2004
Homeowners Insurance Expenditure as a % of Median Home Price The cost of homeowners insurance relative to the price of a typical home has fallen! HO Expenditure as % of Sales Price Median Home Sales Price Source: Insurance Information Institute calculations based on data from National Association of Realtors, NAIC.
Highlights: Property/Casualty First Quarter 2003 ($ Millions) *Comparison with year-end 2002. **Comparison is with full year 2002 combined ratio. Comparable 1st quarter 2002 figure is 102.2.
P/C Net Income After Taxes1991-2003* ($ Millions) • 2001 was the first year ever with a full year net loss • 2002 ROE = 1.0% • 2003 ROE = 8.8%* *First quarter Sources: A.M. Best, ISO, Insurance Information Institute.
ROE: P/C vs. All Industries 1987–2003E* *2003 p/c estimate based on first quarter data. Source: Insurance Information Institute; Fortune
ROE vs. Cost of Capital: US P/C Insurance:1991 – 2003E The gap between the industry’s cost of capital and its rate of return is narrowing 2.2 pts 14.6 pts 10.2 pts US P/C insurers missed their cost of capital by an average 6.9 points from 1991 to 2002 Source: The Geneva Association, Ins. Information Inst.
After-Tax ROE for Selected AY Combined Ratios* *Assumes 4% tax-equivalent yield, 28% expense ratio and 140% premium/surplus ratio Source: Dowling & Partners Securities
P/C Industry Combined Ratio Combined Ratios 1970s: 100.3 1980s: 109.2 1990s: 107.7 2000s: 111.0 2001 = 115.7 2002 = 107.2 2003F = 103.2* 2003:Q1 Actual = 99.5 *Based on III Earlybird Survey, February 2003. Sources: A.M. Best; III
Combined Ratio: Reinsurance vs. P/C Industry • 2001’s combined ratio was the worst-ever for reinsurers; 2003 was bad as well. • 2003: Big improvement in Q1 • Light weather helped Q1:03 *First quarter 2003 figures from RAA, ISO. Source: A.M. Best, ISO, Reinsurance Association of America, Insurance Information Institute
Underwriting Gain (Loss)1975-2003* $ Billions Based on first quarter results, 2003 will likely be a much better year in terms of underwriting losses. First quarter losses totaled $1.46 billion or $5.8 billion on an annualized basis *2003 figure of $5.84 billion is annualized based on first quarter underwriting loss of $1.46 billion Source: A.M. Best, Insurance Information Institute
P/C Insurance Industry Prior Year Reserve Development* Adverse reserve development of about $23 billion accounted for most of the industry’s 2002 underwriting loss and “ate” much of the industry’s $37 billion increase in earned premiums *Negative numbers indicate favorable development; positive figures represent adverse development. Source: A.M. Best, Morgan Stanley, Dowling & Partners Securities
P/C Company Insolvency Rates,1993 to 2002 • Insurer insolvencies are increasing • 10-yr industry failure rate: 0.72% • Failure rating for B+ or better rating: 0.49% • Failure rate for D through B rating: 1.29% 10-yr Failure Rate = 0.72% 30 30 38 Source: A.M. Best; Insurance Information Institute
Net Investment Income Investment income fell 2.8%in 2002 and 0.3% in Q1 of 2003 (v. Q1:2002) due primarily to historically low interest rates -$5.6 Billion Billions (US$) History 1997 Peak = $41.5B • = $40.7B • = $37.7B • = $36.7B • E = $35.9B Note: 2003 estimate is based on annualized first quarter investment income of $8.984 billion. Source: A.M. Best, Insurance Information Institute
Total Returns for Large Company Stocks: 1970-2003* S&P 500 up 14.0% so far this year • 2002 was 3rd consecutive year of decline for stocks • Will it be the last? *As of July 18, 2003. Source: Ibbotson Associates, Insurance Information Institute
P/C Industry Investments,by Type (as of Dec. 31, 2001) Common stock accounts for about 1/5 of invested assets Bond Holdings, by Type Industrial & Misc. 32.5% Special Revenue 30.5% Governments 18.0% States/Terr/Other 15.4% Public Utilities 3.1% Parents/Subs/Affiliates 0.5% Source: A.M. Best, Insurance Information Institute
Property/Casualty Insurance Industry Investment Gain* Investment gains are simply returning to “pre-bubble” levels *Investment gains consists primarily of interest, stock dividends and realized capital gains and losses. Source: Insurance Services Office; Insurance Information Institute estimate annualized as of 3/31/03.
Policyholder Surplus: 1975-2003* Surplus (capacity) peaked at $336.3 Billion in mid-1999 and fell by 15.2% ($51 billion) to $285.2 billion at year-end 2002 (a trough?) • Surplus during the first quarter of 2003 rose by $4B or 1.4% to $289.2B $47 Billion $ Billions “Surplus” is a measure of underwriting capacity. It is analogous to “Owners Equity” or “Net Worth” in non-insurance organizations Source: A.M. Best, Insurance Information Institute *First Quarter
…But is the Bond BubbleAbout to Burst? Rates Will Rise! WHY RATES WILL RISE • Expectation of improving economy • Rotation out of bonds into stocks • Recording breaking government budget deficits leading to massive borrowing The yield on 10-year notes is up 107 basis points in just over a month, despite the Fed’s easing Source: Board of Governors of the Federal Reserve; Insurance Information Institute
Federal Budget Deficit:Is it Out of Control? Record Deficits: FY 2003: $455B 2004: $475 Source: Congressional Budget Office, Office of Management and Budget (July 2003); Insurance Information Institute
Why Insurers Use Credit Information in Insurance Underwriting • There is a strong correlation between credit standing and loss ratios in both auto and homeowners insurance. • There is a distinct and consistent decline in relative loss ratios (which are a function of both claim frequency and cost) as credit standing improves. • The relationship between credit standing and relative loss ratios is statistically irrefutable. • The odds that such a relationship does not exist in a given random sample of policyholders are usually between 500, 1,000 or even 10,000 to one. Source: Insurance Information Institute.
What You Might Not Know About Insurance Scoring • Insurers have been using credit since early 1990s • Credit has been used in commercial insurance for decades • Insurance scores do not use the following information: • Ethnicity Nationality Religion Age • Gender Marital Status Familial Status Income • Address Handicap • Insurance scoring is revenue neutral • Increased use of credit information is a fact of life in the 21st century (Why?: Works for trust-based relationships) • Loans Leases Rentals Insurance • Utilities Background Checks Empl. Screening • NEXT: Preferred airport screening for frequent fliers Source: Insurance Information Institute
Intuition Behind Insurance Scoring* • Personal Responsibility • Responsibility is a personality trait that carries over into many aspects of a person’s life • It is intuitive and reasonable to believe that the responsibility required to prudently manage one’s finances is associated with other types of responsible and prudent behaviors, for example: • Proper maintenance of homes and automobiles • Safe operation of cars • Stability • It is intuitive and reasonable to believe that financially stable individuals are likely to exhibit stability in many other aspects of their lives. • Stress/Distraction • Financial stress could lead to stress, distractions or other behaviors that produce more losses (e.g., deferral of car/home maintenance). *This list is neither exhaustive nor is it intended to characterize the behavior of any specific individual. Source: Insurance Information Institute
Consequences of Banning Use of Credit in Insurance Underwriting • Banning the use of credit information will: • Raise premiums for good drivers and responsible homeowners to subsidize those with poor loss histories by millions of dollars each year. • Decrease incentives to drive safely • Decrease incentives to properly maintain cars and homes • Force insurers to rely on less accurate types of information, such as DMV records. • Make non-standard risks more difficult to place • Increase size of residual market pools/plans
Risk & LossAccounting for Differences in Losses by Risk Characteristics Makes Insurance Pricing More Equitable
Age of Drivers Involved in Auto Accidents, 2000 Interpretation: Drivers age 16-20 are 2 to 3 times more likely to be involved in auto accidents. Should this be ignored with better, more experienced drivers subsidizing teenagers? OF COURSE NOT! Source: National Highway Traffic Safety Administration, Traffic Safety Facts 2000.
Credit Quality & Auto Insurance* Interpretation Individuals with the lowest scores have losses that are 32.4% above average; those with the best scores have losses that are 33.3% below average. Should those who impose less cost on the system be forced to subsidize those who impose more? *Actual data from sampled company. More examples are given later in this presentation. Source: Tillinghast Towers-Perrin
Actual Example:How Insurer Use of Credit Benefits Consumers &What Consumers Stand to Lose
Example: Insurance Savings from Use of Credit Information • Insured lives in Westchester County, NY (NYC suburb) • 2 fully insured vehicles ($250K/$500K liability, $1000 deductible) • 2000 Nissan Xterra & 1994 Honda Civic • Insured’s biannual premium was $862 (March 2003 renewal) • No accidents or moving violations on record • Insured’s credit-related discount for the 6-month period was $148 out of $410 in total discounts. • Credit-related discount saves consumer nearly $300/year • Effectively lowers premium by 14.7% • Should this (and millions of other) consumers be denied this discount? Some regulators and consumer groups want you to pay more unnecessarily and subsidize bad drivers. • August 2002 FICO Score = 777 (out of 850) (= 72nd percentile) • i.e., 28% have better (higher) scores, 72% have lower (worse) scores
Example (cont’d): Credit Discount Can Save $100s per Year* • Credit discount lowered annual premium by 14.7% • Policyholder saved nearly $300 • Credit was single largest discount • Opponents of credit will force people to pay more for coverage Total Annual Savings from Discounts: $820 $154 $296 $196 $174 *Annualized savings based on semi-annual data from example Source: Insurance Information Institute
Review of the Evidence:3 Recent Analyses(detailed review available in III credit presentation)
Texas Auto: Relative Loss Ratio (by Credit Score Decile, Total Market)* Interpretation: Those with poorest credit scores generated losses more than double that of those with the best scores Extremely strong statistical evidence linking credit score with loss/claim outcomes: • Credit score & likelihood of positive claim (p<.0001) • Size of loss related to credit score (p<.0001) • Correlation between relative loss ratio and credit score (r = .95) *Each decile contains approximately 15,300 policies. Includes standard and non-standard policyholders. 1st Decile = Lowest Credit Scores 10th Decile = Highest Credit Scores. Source: University of Texas, Bureau of Business Research, March 2003.
Texas Auto: Average Loss per Policy (by Credit Score Decile, Total Market) Interpretation: Those with poorest credit scores generated incurred losses 65% higher those with the best scores 1st Decile = Lowest Credit Scores 10th Decile = Highest Credit Scores. Source: University of Texas, Bureau of Business Research, March 2003.
NAIC (EPIC) Study (June 2003) • Analyzed random sample of claim records totaling 2.7 million earned car years from all 50 states for period from 7/1/00 through 6/30/01 • 4 MAJOR FINDINGS: • 1. Insurance scores were found to be correlated with the propensity of loss (primarily due to frequency) • 2. Insurance scores significantly increase accuracy of the risk assessment process, even after fully accounting for interrelationships with other variables. • 3. Insurance scores are among the 3 most important risk factors for each of the 6 coverage types studied • 4. Study results apply generally to all states and regions
Indicated Relative Pure Premium by Insurance Score (PD Liability)* Interpretation: Those with poorest credit scores had loss experience 33% above average while those with the best scores had loss experience that was 19% below average Source: EPIC Actuaries, June 2003
Importance of Rating Factors by Coverage Type Source: The Relationship of Credit-Based Insurance Scores to Private Passenger Automobile Insurance Loss Propensity Michael Miller, FCAS and Richard Smith, FCAS (EPIC Actuaries), June 2003 (Presented at June 2003 NAIC meeting).
Washington State Study on Credit Scoring in Auto UW & Pricing • STUDY DESIGN • WA State study released in January 2003 required under ESHB 2544, which also restricted the use of scoring • Conducted by Washington State University (WSU) • Objective was to determine who benefits/is “harmed” by scoring, impact of scoring on rates, disparate impacts on “the poor” or “people of color” • Sampled about 1,000 auto policyholders from each of 3 insurers: age, gender, zip, inception date, score/rate class. • Study’s models typically explain only 5% - 15% of variation (very low R-square in regression analyses) • WSU contacted policyholders asked: ethnicity, marital status, income, details of experience if cancelled
Washington State Study on Credit Scoring in Auto UW & Pricing • SUMMARY OF FINDINGS • Statistically the findings are extremely weak, leading even the study’s author to conclude: “The …models only explain a fraction of the variance in score or discount found in the sample population” and that “…while there are statistically detectable patterns in the demographics of credit scoring, most of the variation among individual scores is to due to random chance or other facts not in this data.” • Study’s models typically explain only 5% - 15% of variation (very low R-square in regression analyses). • Strongest and most consistent finding is that credit score is positively associated with age • Implication: banning on scoring creates disparate impact on older, more experienced drivers
Problems With Such Studies • Already statistically irrefutable evidence that scoring works. This fact is ignored in WA study. • Ignores fact that scoring is 100% blind to ethnicity, color, gender, marital status, income, location, etc. • Introduces the divisive issue of race into an issue where it does not belong (and doesn’t exist today) • Perpetuates false stereotype that minorities and the poor are incapable of managing their finances responsibly • Puts regulators in awkward position of determining who is a minority, who is poor • Lead to disparate impacts on groups such as older drivers, people who file few claims, and millions of minorities and low income people who benefit today • Leads to poor public policy decisions that produce perverse economic incentives (e.g., subsidies to drivers who have higher relative losses)