Download
1 / 14
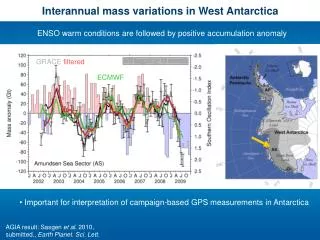
140 likes | 267 Views
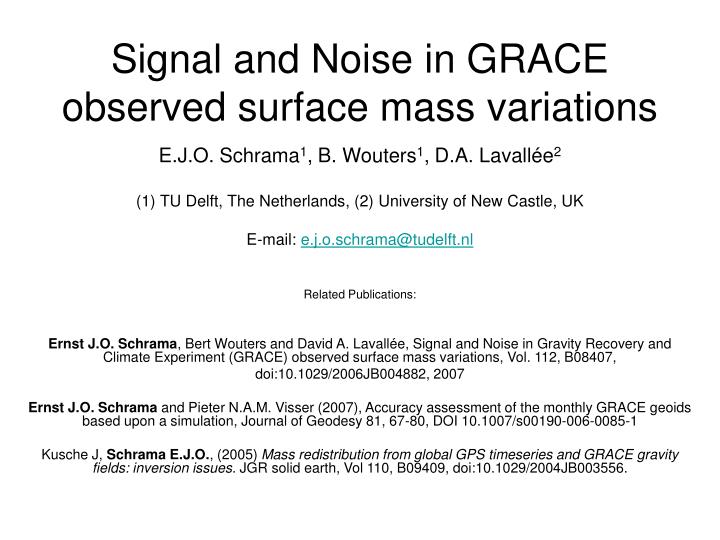
Signal and Noise in GRACE observed surface mass variations. E.J.O. Schrama 1 , B. Wouters 1 , D.A. Lavallée 2 (1) TU Delft, The Netherlands, (2) University of New Castle, UK E-mail: e.j.o.schrama@tudelft.nl Related Publications:

E N D
Signal and Noise in GRACE observed surface mass variations E.J.O. Schrama1, B. Wouters1, D.A. Lavallée2 (1) TU Delft, The Netherlands, (2) University of New Castle, UK E-mail: e.j.o.schrama@tudelft.nl Related Publications: Ernst J.O. Schrama, Bert Wouters and David A. Lavallée, Signal and Noise in Gravity Recovery and Climate Experiment (GRACE) observed surface mass variations, Vol. 112, B08407, doi:10.1029/2006JB004882, 2007 Ernst J.O. Schrama and Pieter N.A.M. Visser (2007), Accuracy assessment of the monthly GRACE geoids based upon a simulation, Journal of Geodesy 81, 67-80, DOI 10.1007/s00190-006-0085-1 Kusche J, Schrama E.J.O., (2005) Mass redistribution from global GPS timeseries and GRACE gravity fields: inversion issues. JGR solid earth, Vol 110, B09409, doi:10.1029/2004JB003556.
Outline Filter design + tuning • GRACE CSR RL04 solutions are converted into surface mass grids • Empirical Orthogonal Functions are used to separate signal and noise contained in the Gaussian smoothed surface mass grids • Result depends on an EOF approximation level “M” and asmoothing radius “t” • Optimal choice of “M” and “t” follows from observed deformations at selected set of GPS stations within the IGS. Test 1: Degree variance spectra • Signal, EOF residual, GGM02C formal errors, • Background model error tides and air pressure Test 2: Residual analysis • S2 tide and 180 day hydrology in EOF residuals • Auto-covariance functions from EOF residuals are compared to formal covariance functions based on a GSFC GRACE covariance matrix
51.4% 9.5% 12.6% 6.25 deg, CSR RL04, 43 months
Equivalent water height degree spectrum at 6.25 degree smoothing EOF signal EOF residual 0.85*GGM02C NCEP-ECMWF FES2004-GOT00.2
Geoid height degree spectrum at 6.25 degree smoothing EOF signal 0.85*GGM02C EOF residual NCEP-ECMWF FES2004-GOT00.2
Surface mass on 3 EOF modes and 6.25 degree smoothing radius 10 32 100 mm
GPS validation • IGS vertical loading within GRACE window • Accept only those IGS stations where rms of difference relative to GRACE < 3 mm, and where the correlation is greater than 0.5
Formal error for the EQWH map from GRACE covariance matrix GSFC covariance matrix for July 2003 (Frank Lemoine) mm 7.5 degree smoothing
Residual EQWH signal in EOFs 4 and up CM 6.25 degree smoothing
S2 (161 days) • Residual signal in EOF 4 + up: • S2 tide errors • Semi-annual hydrology signal cm 180 days GRACE 180 days GLDAS
W-E Auto-Covariance functions derived from EOFs 4 and up at 173E 0N S-N 6.25 degree smoothing
Conclusions • EOF filter method • 3 EOF modes and 6.25 degree smoothing • Synthetic EOF error = 0.85 * Formal error • Tide and atmosphere pressure errors are 3 to 5 times smaller compared to formal GGM02C errors • GPS validation • 3 modes 5.00 or 6.25 degree smoothing • 59 IGS stations calibration set • Residual signal in EOFs 4 and up • S2 tide errors (161 days) identified • Semi-annual hydrology (180 days) recognized • Auto covariance still reveals North South striping that is not fully explained by the formal covariance matrix