Download
1 / 14
250 likes | 1.19k Views
Environmental Indicators. Today’s Objectives: explain how environmental change can be monitored interpret data to investigate environmental change. Environmental indicators. What does a car indicator can tell us? What does universal indicator paper do?

E N D
Environmental Indicators Today’s Objectives: explain how environmental change can be monitored interpret data to investigate environmental change
Environmental indicators • What does a car indicator can tell us? • What does universal indicator paper do? • This lesson is about ‘environmentalindicators’ what do you think this means?
Answers: • a car indicator: tell us what direction a car is turning, where it will leave a road or roundabout, if it is likely to pull out. A car indicator indicates to others what the car is likely to do next. • Universal indicator paper indicates/tells us the pH of solutions. • ‘environmental indicators’ = ‘something that tells us what the environment is doing’.
Task 1 • Complete Activity 1 on the work sheet.
Task 2 & 3 • Activity 2 - Complete the data analysis questions from the work sheet. • Activity 3 – complete the questions.
Activity 2 (Standard demand) • Q1 In 1975 there was no growth of lichens that grow in the most polluted air, but there were lichens that grow in less polluted air, so sulfur dioxide levels were likely to be low. In 1980 lichens that could withstand high levels of pollution dominated and there were no lichens that could live only in unpolluted air. The sulfur dioxide levels were likely to be high at this time. In 1985 the lichens were those that need cleaner air, so sulfur dioxide levels are likely to have dropped again. In 1990 there were hardly any lichens that grow in highly polluted areas. The population of lichens that need unpolluted air was high. The sulfur dioxide pollution is likely to have been low in the years preceding 1990. • Q2 It was probably built between 1976 and 1979; the pollution level was shown to be higher in 1980. • Q3 Lichens take a long time to grow so can show how polluted the environment has been over a long period.
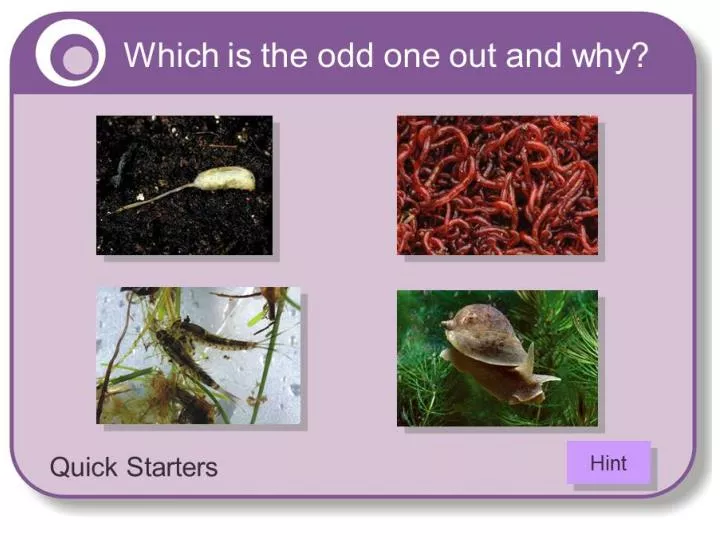
Activity 3 (High demand) • a) A digital thermometer could be used to measure the temperature of the water, perhaps automatically set to record the temperature every hour over a long period of time − before the factory opens as well as afterwards, to show any changes; or thermometers could be used upstream and downstream of the factory for comparison. • b) Survey the invertebrate population initially and then each month; some individual species that are particularly sensitive to temperature change could be chosen as indicator species to monitor more regularly. • c) Species sensitive to pollution could be used as indicators of whether or not the water was becoming more polluted; non-living indicators could also be used, testing for the most likely pollutants from the factory; samples could be taken at different distances downstream from the factory for comparison.
Plenary • (Watch icould video clip – Collins interactive book – L5)