Download
1 / 22
270 likes | 1.73k Views
CARDIAC OUTPUT. Cardiac Output, Venous Return and their Regulation. Cardiac output is controlled to maintain the proper amount of flow to tissues and to prevent undue stress on the heart. Cardiac Output. Generally proportional to body surface area.

E N D
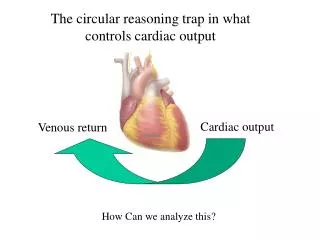
Cardiac Output, Venous Return and their Regulation • Cardiac output is controlled to maintain the proper amount of flow to tissues and to prevent undue stress on the heart.
Cardiac Output • Generally proportional to body surface area. • Cardiac Index (CI): Approximately 3 liters/min/m2 of body surface area. • CI varies with age, peaking at around 8 years.
Frank-Starling Law • What goes into the heart comes out. • Increased heart volume stretches muscles and causes stronger contraction. • Stretch increases heart rate as well. • Direct effect on sino-atrial node • Bainbridge reflex (through the brain)
Cardiac Output • Depends on venous return, which, in turn, depends on the rate of flow to the tissues. • Rate of flow to tissues depends on tissue needs (i.e. it depends on Total Peripheral Resistance). Therefore, cardiac output is proportional to the energy requirements of the tissues.
Limit of Cardiac Output • Normal CO – 5 L/min • Plateau – 13 L/min • Hypereffective heart plateau – 20 L/min • Hypoeffective heart plateau – 5 L/min
Hypereffective Heart • Effected by: • Nervous excitation. • Cardiac Hypertrophy • Exercise – Marathon runners may get 30 to 40 L/min • Aortic Valve Stenosis
Hypoeffective Heart • Valvular disease • Increased output pressure • Congential heart disease • Myocarditis • Cardiac anoxia • Toxicity
Autonomic Nervous System • Causes increased cardiac output when vessels become dilated (dinitrophenol). • Causes venous constriction during exercise.
Disease States Lowering Total Peripheral Resistance • Beriberi: insufficient thiamine – tissues starve because they cannot use nutrients. • AV fistula: e.g. for dialysis. • Hyperthyroidism: Reduced resistance caused by increased metabolism • Anemia (lack of RBCs): effects viscosity and transport of O2 to the tissues.
Disease States Lowering Cardiac Output • Heart attack, valvular disease, myocarditis, cardiac tamponade, shock. • Shock: Nutritional deficiency of tissues. • Decreased venous return caused by: • Reduced blood volume • Venous dilitation (increased circulatory volume) • Venous obstruction
tamponade CO Rt. Atrial Pressure Changes in Intrapleural Pressure Pericardial Sac • Generally shift the cardiac output curve in proportion to pressure change (breathing, Valsalva maneuver). • Cardiac Tamponade (filling of pericardial sac with fluid) lowers rate of change of CO with right atrial pressure Heart 15 L/min
Determinants of Venous Return Mean systemic filling pressure Right Atrial Pressure Resistance to Flow Pressure change is slight. Thus, small increase in RA Pressure causes dramatic reduction in venous return. (mean systemic filling pressure).
Normal Venous Return Curve Plateau: collapse of large veins ( => increased resistance) Working Cardiac Output 5 L/min Venous return with heart and lung removed. Cardiac Output Curve VR (CO) 0 -4 Mean systemic filling pressure ~ 7 mm Hg Rt. Atrial Pressure (mm Hg)
Filling Pressure • Mean Circulatory: The pressure within the circulatory system when all flow is stopped (e.g. by stopping the heart). • Mean Systemic: Pressure when flow is stopped by clamping large veins. • The two are close numerically.
Venous Return & Cardiac Output • Cardiac output increases with atrial pressure. • Normal atrial pressure is about 0 mm Hg. • Venous return (with heart and lungs removed) decreases with atrial pressure. • Working cardiac output is where venous return curve meets cardiac output curve.
Compensation for Increased Blood Volume • Increased CO increases capillary pressure, sending more fluid to tissues. • Vein volume increases • Pooling of blood in the liver and spleen • Increased peripheral resistance reduces cardiac output.
Effects of Sympathetic Stimulation • Increases contractility of the heart. • Decreases volume by contracting the veins. • Increases filling pressure • Increases resistance
Effects of Sympathetic Inhibition • Shifts CO to the right • Shifts venous return down and to the left • - Reduced CO Venous return with heart and lung removed. 5 L/min VR (CO) 0 -4 Rt. Atrial Pressure (mm Hg)
Effects of AV Fistula • Decreased VR resistance. • Slight increased CO because of reduced peripheral resistance. • After restoration of pressure (sympathetic) • Further CO increase. • Increased filling pressure. • Decreased kidney output (leads to higher fluid volume and more increase in CO). • Cardiac hypertrophy (caused by increased workload).
Measurement of CO • Electromagnetic/ultrasonic (transit time) flow meter. • Oxygen Fick method: • CO = (Rate of O2 absorbed by lungs) • [O2]la - [O2]rv • Indicator dilution method: • Inject cold saline (or dye) into RA, measure temperature (or concentration) in aorta.