Download
1 / 32
330 likes | 813 Views
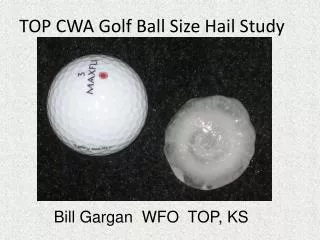
TOP CWA Golf Ball Size Hail Study Bill Gargan WFO TOP, KS Why I conducted this research? To find techniques to help forecasters, while analyzing storms on radar, to generate more accurate warnings and severe weather statements for golf ball size hail.

E N D
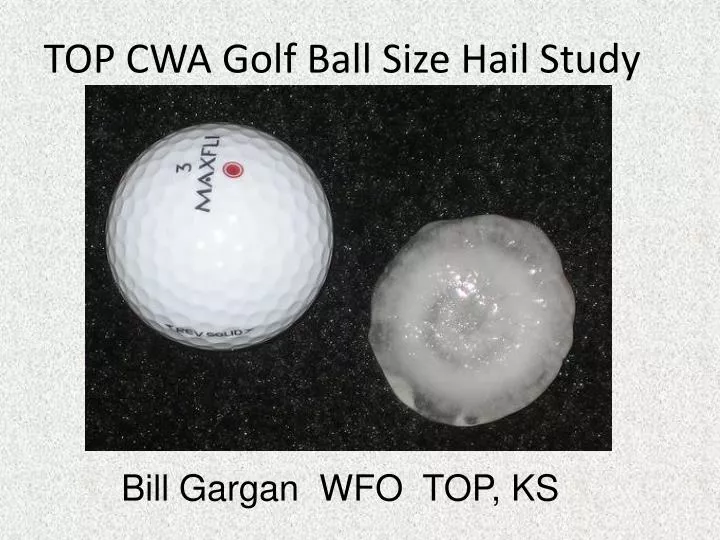
TOP CWA Golf Ball Size Hail Study Bill Gargan WFO TOP, KS
Why I conducted this research? • To find techniques to help forecasters, while analyzing storms on radar, to generate more accurate warnings and severe weather statements for golf ball size hail. • Golf ball size hail can cause considerably more damage than quarter size hail.
DATA • Archived reflectivity (Zr) and storm relative velocity (SRM) data was obtained from both the KTWX and KEAX radars. Archived radiosonde data from the KTOP upper air observing site was used to obtain the height of both the melting and -20 degree C levels. • 174 golf ball size hail reports were obtained from Storm Data across the TOP County Warning Area from 1999 to 2008.
The following components analyzed from Zr and radiosonde data • Maximum Zr at -20 degree C. (From HDA, most severe hail growth occurs with temperatures near -20C or colder. ) • Maximum Zr value and corresponding AGL height. • 2Vr (rotation). • Storm Top Divergence. • 50 dBZ Height vs the melting level height. (Donovan 1”) • Percentage of storms with identifiable BWER • Percentage of storms with three-body scatter signature.
Data collection methodology • The radar data was analyzed up to 2 volume scans before the time of a golf ball size hail report and up to one volume scan after the time of a golf ball size hail report. For all the radar parameters, I looked at the maximum values within the time frame. • Some observation errors are inherent to this study based on the over and under estimation of hail size by the storm spotters, and potential errors in the time of the report.
The following components analyzed from Zr and radiosonde data • Maximum Zr at -20 degree C • Maximum Zr value and corresponding AGL height. • 2Vr (rotation). • Storm Top Divergence vs the melting level height. • 50 dBZ Height vs the melting level height. • Percentage of storms with identifiable BWER • Percentage of storms with three-body scatter signature.
The following components analyzed from Zr and radiosonde data • Maximum Zr at -20 degree C • Maximum Zr value and corresponding AGL height. • 2Vr (rotation). • Storm Top Divergence. • 50 dBZ Height vs the melting level height. • Percentage of storms with identifiable BWER • Percentage of storms with three-body scatter signature.
The following components analyzed from Zr and radiosonde data • Maximum Zr at -20 degree C. • Maximum Zr value and corresponding AGL height. • 2Vr (rotation). • Storm Top Divergence vs the melting level height. • 50 dBZ Height vs the melting level height. • Percentage of storms with identifiable BWER • Percentage of storms with three-body scatter signature.
The following components analyzed from Zr and radiosonde data • Maximum Zr at -20 degree C • Maximum Zr value and corresponding AGL height. • 2Vr (rotation). • Storm Top Divergence. • 50 dBZ Height vs the melting level height. • Percentage of storms with identifiable BWER • Percentage of storms with three-body scatter signature.
Storm Top Divergence (STD) • Divergence was observed at or near the top of the storm using SRM. • STD = |∇(Vro,-Vri)|= |Vro – ( -Vri)|
Mean STP X = 109 KTS, SDV= +/- 25 KTS, X-STD=(84 KTS, 134 KTS)
The following components analyzed from Zr and radiosonde data • Maximum Zr at -20 degree C • Maximum Zr value and corresponding AGL height. • 2Vr (rotation). • Storm Top Divergence. • 50 dBZ Height vs the melting level height. • Percentage of storms with identifiable BWER • Percentage of storms with three-body scatter signature.
Mean X = 39.1, STD = +/-5.9, 2STD = +/-11.8, X-STD = (45,33), X-2STD = (51,27)
50 dBZ Height vs. Melting Level • Recorded the approximate 50 dBz height for each storm where Golf Ball Size hail was observed. • Plotted the 50 dBz height vs the height of the melting level.
The following components analyzed from Zr and radiosonde data • Maximum Zr at -20 degree C • Maximum Zr value and corresponding AGL height. • 2Vr (rotation). • Storm Top Divergence. • 50 dBZ Height vs the melting level height. • Percentage of storms with identifiable BWER • Percentage of storms with three-body scatter signature.
Examining Storm Structure • I noted all the storms that had either a Three Body Scatter Spike (TBSS) and/or Bounded Weak Echo Region (BWER).
BWER result • 10 percent of the storms that produced Golf Ball size hail had a definable BWER’s. • Almost every storm examined had a WER. • BWER detection is often dependent on distance from radar and beamwidth
TBSS results • 15 percent of the storms that produced Golf Ball size Hail had a definable TBSS. • However, TBSS cannot be seen easily for many azimuths of the storm, relative to the RDA location, i.e. TBSS could be difficult to see where it would be placed in an area already covered by precipitation.
Final Result • The best correlation was noted between the 0 deg C height and 50 dBZ height. A polynomial can be fitted to provide a 50 dBZ height given the observed (SND) or forecasted (RUC) 0 deg C height.
Another Finding • Observing the height of the 50 dBZ core along with STD may provide you with a technique to rule out a storm’s potential for producing golf ball size hail.
STD vs 50 dBZ Height • Less than 3 percent of all Golf Ball size hail reports occurred with 50 dBZ heights less than 30,000 feet and STD less than 80 KTS. • Less than 6 percent of all Golf Ball size hail reports occurred with 50 dBz heights less than 30,000 feet.
Conclusion • The 50 dBz height vs the melting level gives the best correlation from this study may and help the radar operator to determine when a severe storm may produce Golf Ball size hail. • Increase confidence in determining when a storm is capable of, or unlikely, to produce golf ball size hail and may lead to more accurate hail size inclusion in SVS’s. • Point soundings from the time and location of observed golf ball size hail from using NARR grib data would have given more accurate melting levels.
Future Research • To use NARR grib data, instead of the 12Z or 00Z TOP upper air data, to determine melting height for both the location and time of golf ball size hail report. • Use the NARR grib data to determine how well the Maximum Expected Hail Size (MEHS) algorithm performs. • Currently examining Radar and Environmental Conditions associated with Baseball size hail in the NWS Topeka County Warning Area • Also, one of several co-PI’s working on a four inch and larger hail study across the plains states.