Download
1 / 1
10 likes | 66 Views
290. 310. 330. 350. 0. 10. 20. 30. 40. 25. 25. 15. 15. MF output. MF output. 5. 5. 480. 440. 460. 500. 520. 480. 440. 460. 500. 520. 480. 440. 460. 500. 520. 0. 0. 0. Detection MF. Tracking MHT. 10. 10. 10. 20. 20. 20. 30. 30. 30. 40. 40. 40. 50.

E N D
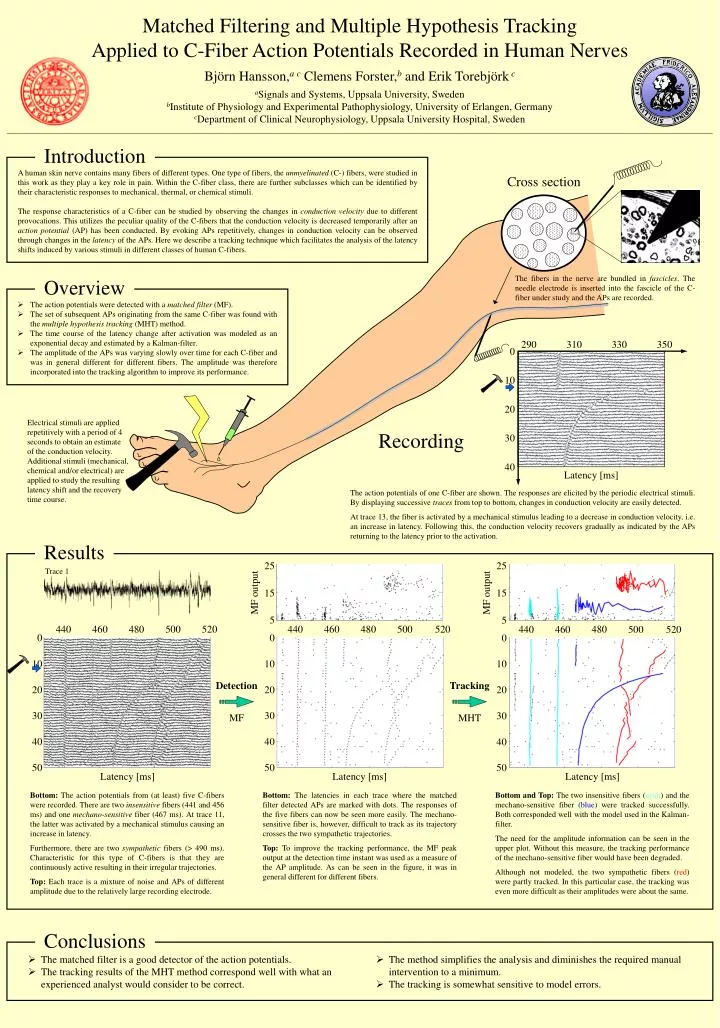
290 310 330 350 0 10 20 30 40 25 25 15 15 MF output MF output 5 5 480 440 460 500 520 480 440 460 500 520 480 440 460 500 520 0 0 0 Detection MF Tracking MHT 10 10 10 20 20 20 30 30 30 40 40 40 50 50 50 Matched Filtering and Multiple Hypothesis Tracking Applied to C-Fiber Action Potentials Recorded in Human Nerves Björn Hansson,a c Clemens Forster,b and Erik Torebjörkc aSignals and Systems, Uppsala University, Sweden bInstitute of Physiology and Experimental Pathophysiology, University of Erlangen, Germany cDepartment of Clinical Neurophysiology, Uppsala University Hospital, Sweden Introduction A human skin nerve contains many fibers of different types. One type of fibers, the unmyelinated (C-) fibers, were studied in this work as they play a key role in pain. Within the C-fiber class, there are further subclasses which can be identified by their characteristic responses to mechanical, thermal, or chemical stimuli. The response characteristics of a C-fiber can be studied by observing the changes in conduction velocity due to different provocations. This utilizes the peculiar quality of the C-fibers that the conduction velocity is decreased temporarily after an action potential (AP) has been conducted. By evoking APs repetitively, changes in conduction velocity can be observed through changes in the latency of the APs. Here we describe a tracking technique which facilitates the analysis of the latency shifts induced by various stimuli in different classes of human C-fibers. Cross section READ ME! Dear downloader, Thank you for your interest in my research! This poster was presented on the SPIE conference Signal and Data Processing of Small Targets 1998 in Orlando Apr 13-17, 1998. To facilitate the design of the poster, I chose the A2 page size. It is however printable in A4 if you choose the alternative Fit on paper or Passa in på papper (swedish). If you have any questions or comments, please feel free to contact me. Best whishes, Björn --------------------------------------------------------------------- Bjorn Hansson, PhD student in Neurophysiological Signal Processing Dep. of Clinical Neurophysiology Signals and Systems University Hospital Uppsala University http://www.neurofys.uu.se http://www.signal.uu.se E-mail: Bjorn.Hansson@neurofys.uu.se, or Bjorn.Hansson@signal.uu.se Overview The fibers in the nerve are bundled in fascicles. The needle electrode is inserted into the fascicle of the C-fiber under study and the APs are recorded. • The action potentials were detected with a matched filter (MF). • The set of subsequent APs originating from the same C-fiber was found with the multiple hypothesis tracking (MHT) method. • The time course of the latency change after activation was modeled as an exponential decay and estimated by a Kalman-filter. • The amplitude of the APs was varying slowly over time for each C-fiber and was in general different for different fibers. The amplitude was therefore incorporated into the tracking algorithm to improve its performance. Electrical stimuli are applied repetitively with a period of 4 seconds to obtain an estimate of the conduction velocity. Additional stimuli (mechanical, chemical and/or electrical) are applied to study the resulting latency shift and the recovery time course. Recording Latency [ms] The action potentials of one C-fiber are shown. The responses are elicited by the periodic electrical stimuli. By displaying successive traces from top to bottom, changes in conduction velocity are easily detected. At trace 13, the fiber is activated by a mechanical stimulus leading to a decrease in conduction velocity, i.e. an increase in latency. Following this, the conduction velocity recovers gradually as indicated by the APs returning to the latency prior to the activation. Results Trace 1 Latency [ms] Latency [ms] Latency [ms] Bottom: The action potentials from (at least) five C-fibers were recorded. There are two insensitive fibers (441 and 456 ms) and one mechano-sensitive fiber (467 ms). At trace 11, the latter was activated by a mechanical stimulus causing an increase in latency. Furthermore, there are two sympathetic fibers (> 490 ms). Characteristic for this type of C-fibers is that they are continuously active resulting in their irregular trajectories. Top: Each trace is a mixture of noise and APs of different amplitude due to the relatively large recording electrode. Bottom: The latencies in each trace where the matched filter detected APs are marked with dots. The responses of the five fibers can now be seen more easily. The mechano-sensitive fiber is, however, difficult to track as its trajectory crosses the two sympathetic trajectories. Top: To improve the tracking performance, the MF peak output at the detection time instant was used as a measure of the AP amplitude. As can be seen in the figure, it was in general different for different fibers. Bottom and Top: The two insensitive fibers (cyan) and the mechano-sensitive fiber (blue) were tracked successfully. Both corresponded well with the model used in the Kalman-filter. The need for the amplitude information can be seen in the upper plot. Without this measure, the tracking performance of the mechano-sensitive fiber would have been degraded. Although not modeled, the two sympathetic fibers (red) were partly tracked. In this particular case, the tracking was even more difficult as their amplitudes were about the same. Conclusions • The matched filter is a good detector of the action potentials. • The tracking results of the MHT method correspond well with what an experienced analyst would consider to be correct. • The method simplifies the analysis and diminishes the required manual intervention to a minimum. • The tracking is somewhat sensitive to model errors.