Download
1 / 5
50 likes | 142 Views
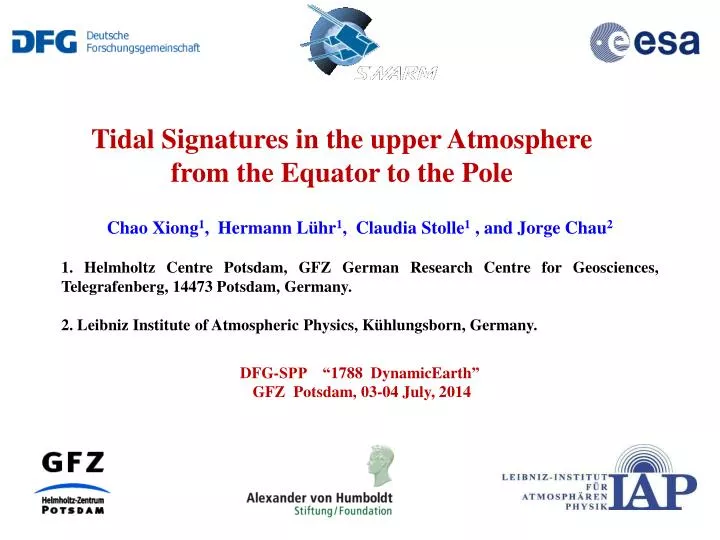
Tidal Signatures in the upper Atmosphere from the Equator to the Pole. Chao Xiong 1 , Hermann Lühr 1 , Claudia Stolle 1 , and Jorge Chau 2 1 . Helmholtz Centre Potsdam, GFZ German Research Centre for Geosciences, Telegrafenberg , 14473 Potsdam, Germany.

E N D
Tidal Signatures in the upper Atmosphere from the Equator to the Pole Chao Xiong1, Hermann Lühr1, Claudia Stolle1, and Jorge Chau2 1. Helmholtz Centre Potsdam, GFZ German Research Centre for Geosciences, Telegrafenberg, 14473 Potsdam, Germany. 2. Leibniz Institute of Atmospheric Physics, Kühlungsborn, Germany. DFG-SPP “1788 DynamicEarth” GFZ Potsdam, 03-04 July, 2014
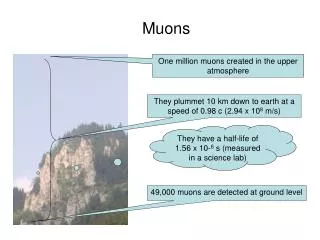
WN4 and WN3 as well as Midlatitude Summer Night Anomaly (MSNA) ? Northern hemi Midlatitude Summer Night Anomaly (MSNA) observed by satellites observations (Lin et al., 2009; Thampi et al., 2010; Liu et al., 209). Electron density Equatorial region Equatorial Electrojet ? Southern hemi (Lühr and Manoj., 2013) Weddell Sea Anomaly (WSA), first observed by an ionosode in the 1950s (Bellchambers and Piggott, 1958; Penndorf, 1965). Electron density (Liu et al., 2010)
Wave-1 and Wave-2 patterns of MSNA in the two hemispheres 40°~60° MLAT Electron density -40°~-60° MLAT (Xiong and Lühr., 2014) CHAMP GRACE Thermospheric mass density
Swarm Observations during solstice seasons June. S. 2013 Northern hemisphere Swarm-C Swarm-A Swarm-B Swarm-C Swarm-A Swarm-B Dec. S. 2013 Southern hemisphere
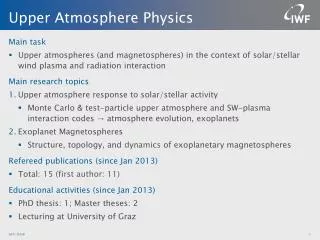
The opportunity Swarm provides us 500 km Atmosphere-Ionosphere Coupling by Tides & Planetary Waves E B wind transport tidal penetration Ionosphere-Thermosphere (IT) equatorial anomaly plasma flow E composition changes tidal dynamo tidal dissipation Atmosphere-Space Interaction Region The Swarm constellation provides us good opportunity for better understanding the Atmosphere-Ionosphere (AI) coupling mechanisms at different latitude regions: 1. Analyzing the tidal signatures of ionospheric and thermosperic quantities. 2. Compare the tidal signatures at different altitudes. 3. Compare the Swarm in situ observations with groundbasedmeasuremtns, to separate the different sources of the tides. Mesopause O3 H2O Tides Lower Atmosphere Tides PWs The primary mechanism through which energy and momentum are transferred from the lower atmosphere to the upper atmosphere and ionosphere is through the generation and propagation of waves (Forbes et al., 2014). 0 km Equator Pole