Download
1 / 28
280 likes | 510 Views
Re-conceptualizing SWAT for Variable Source Area Hydrology. Zachary Easton 1* , Daniel Fuka 1 , Todd Walter 1 , Dillon Cowan 2 , Elliot Schneiderman 3 , Tammo Steenhuis 1 1 Dept. Biological and Environmental Engineering, Cornell University

E N D
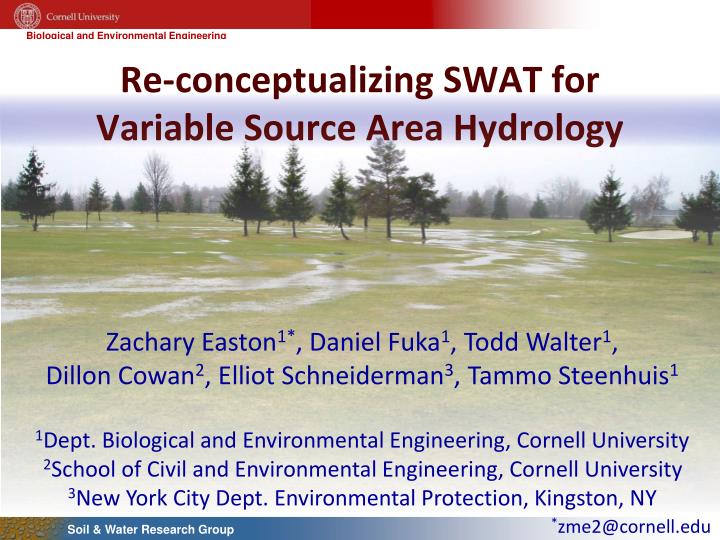
Re-conceptualizing SWAT for Variable Source Area Hydrology Zachary Easton1*, Daniel Fuka1, Todd Walter1, Dillon Cowan2, Elliot Schneiderman3, Tammo Steenhuis1 1Dept. Biological and Environmental Engineering, Cornell University 2School of Civil and Environmental Engineering, Cornell University 3New York City Dept. Environmental Protection, Kingston, NY *zme2@cornell.edu
Re-conceptualizing SWAT • Variable Source Area (VSA) Hydrology • Curve Number and VSA hydrology • Convincing SWAT it recognizes VSAs
Infiltration “Runoff” Common Perception of Runoff Rain Infiltration Excess a.k.a. Hortonian Flow (Horton 1933, 1940)
NewYork 100 90 80 June 70 60 May September July 50 % of Area Generating Hortonian Flow 40 August 30 20 October April 10 November 0 March 1 10 100 Return Period (yr) Is Hortonian Flow Common? Walter et al. 2003. ASCE J. Hydrol. Eng. 8: 214-218
Rain Subsurface water rises Some areas saturate to the surface Saturation Excess Runoff
Rain Upland interflow may exfiltrate Saturation Excess Runoff Rain on saturated areas becomes overland flow Dunne and Black. 1970. Water Resour. Res. 6: 478-490 Dunne and Black. 1970. Water Resour. Res. 6: 1296-1311
Flow Path Variable Source Areas • Current Water Quality Models were not Intended to Capture this Complexity • General Watershed Loading Function (GWLF) • Soil Water Assessment Tool (SWAT) • Agricultural Nonpoint Source Pollution Model (AGNPS)
Re-conceptualizing SWAT • Variable Source Area (VSA) Hydrology • Curve Number and VSA hydrology • Convincing SWAT it recognizes VSAs
USDA-NRCS Curve Number Model “Runoff”=Pe2/(Pe+S) S=25400/CN-254 Tables link CN to land use and soil infiltration capacity
Curve Numbering VSA hydrology P Q = Pe2/(Pe+S) Watershed Q Af DQ = AfDPe Unsaturated Saturated dQ/dPe = Af Af = f(S,Pe) Steenhuis et al. 1995. ASCE Div Drain. & Irr. 121:234-238
We know how much area is contributing… Af = f(S,Pe) …but from where in the landscape?
Soil Topographic IndexWetness Index Classes Soil Topographic Index Wetness Index Classes s8=f(S) 10 s7=f(S) 33.10 3.52 s9=f(S) s10=f(S) 1 s1=f(S) si = local storage s6=f(S) s2=f(S) s5=f(S) s3=f(S) Easton et al., 2008. J. Hydrol. 348: 279-291. Lyon et al. 2004. Hydrol. Proc. 18(15): 2757-2771. Schneiderman et al. 2007. Hydrol. Proc. 21: 3420-3430. s4=f(S)
Re-conceptualizing SWAT • Variable Source Area (VSA) Hydrology • Curve Number and VSA hydrology • Convincing SWAT it recognizes VSAs
Revisit the HRU concept • Define HRUs as the coincidence of soil type and landuse • Hydrological/chemical properties are defined at the HRU • So runoff/P loss is the same here (lowland pasture) • As here (upland pasture) • Is this a good assumption? Landuse Soils HRUs
VSA concept defines HRUs as the coincidence of soil topographic index and landuse • So runoff/P loss is now not the same here (lowland pasture) • As here (upland pasture) • Better Assumption? STI Landuse SSURGO HRUs
Distributing CN-values • Average of Standard CNs = 73.1 distributed according to landuse/soils • Average of VSA CNs = 73.1, distributed according to a wetness index Wetness Index Classes 10 1
Modify the Available Water Content • High runoff prone area = high moisture content (in general) • We relate local soil water storage, e,i, to AWC with the following: • ρb = soil bulk density (g cm-3) • clay = soil clay content (cm3 cm-3). Wetness Class 10 Wetness Class 9 Wetness Class 2 Wetness Class 1
Test Results: Streamflow r2= 0.76 E = 0.82 r2 = 0.74 E = 0.83 -Standard
Test Results: Runoff from Pastures SWAT-VSA SWAT-Standard Easton et al., 2008. J. Hydrol. 348: 279-291
Test Results: Runoff SWAT-VSA SWAT-Standard Easton et al., 2008. J. Hydrol. 348: 279-291
Test Results: Soil water SWAT-VSA SWAT-Standard Easton et al., 2008. J. Hydrol. 348: 279-291
N 0 100 m Data curtsey of : Lyon et al. 2006. Adv. Water Resour. 29(2): 181-193. Lyon et al. 2006. HESS. 10: 113-125. Wetness Index Classes Test Results: Soil Water 10 1 585 m 1m Cont. Water Level Loggers 600 m
SWAT-VSA Movie courtesy of Dr. Steve Lyon
Test Results: Soil water a b Index Easton et al., 2008. J. Hydrol. 348: 279-291
Test Results: Phosphorus a r2 = 0.76 E = 0.71 b -Standard r2 = 0.68 E = 0.47
Test Results: Phosphorus SWAT-VSA SWAT-Standard
Take-home Messages • Storm runoff is generated from small parts of the landscape • Areas prone to saturate – e.g., toe slopes, shallow soils, topographically converging areas • Variable Source Areas – they expand and contract • We can predict where and when storm runoff will be generated • We can improve integrated and distributed predictions by considering VSAs • Implications for watershed management
Curve Numbering VSA hydrology Q = Pe2/(Pe+S) P Af = dQ/dPe Watershed Af = 1-(S2/(Pe+S)2 Q Af As= 1-(S2/(σe+S)2 Unsaturated Saturated σe=S(√(1/(1-As))-1 Af = f(S,Pe) Steenhuis et al. 1995. ASCE Div Drain. & Irr. 121:234-238