Download
1 / 27
270 likes | 414 Views
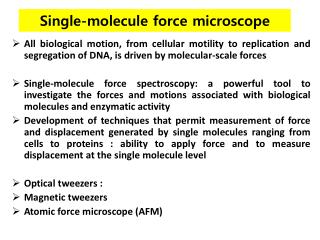
Single-molecule optical proteomics in vivo. Bionanotechnology option, Biochemistry Dr. Mark Leake, Oxford University. www.physics.ox.ac.uk/physics/users/leake. Two experimental case studies investigating “established bionanotechnology” in living, functioning cells.

E N D
Single-molecule optical proteomics in vivo Bionanotechnology option, Biochemistry Dr. Mark Leake, Oxford University www.physics.ox.ac.uk/physics/users/leake
Two experimental case studies investigating “established bionanotechnology” in living, functioning cells
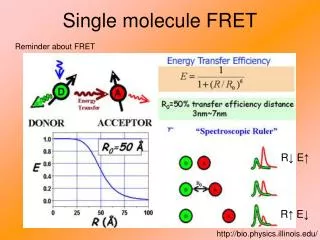
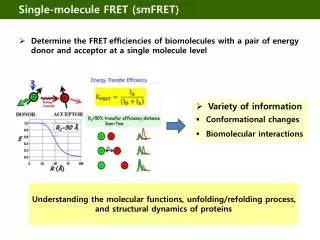
1. Total Internal Reflection Fluorescence Microscopy (TIRFM) 2. Calibrations using Green Fluorescent Protein in vitro 3. Low-light measurements in vivo different biological systems: additional microscopy techniques: • motility • Fluorescence Recovery After Photobleaching (FRAP) • protein transport • chemotaxis • Fluorescence Loss In Photobleaching (FLIP) • cell shape and structure • Fluorescence Imaging with One Nanometre Accuracy (FIONA) • Foerster Resonace Energy Transfer (FRET)
In vitro detection of single fluorophores using purified green-fluorescent protein [GFP]: a) b) c) (a) 2D and (b) 3D raw pixel intensities from CCD array for GFP binding transiently to glass (white bar=1mm). (c) examples of raw (red) and Chung-Kennedy [CK] filtered (black) summed intensities for 6x6 pixel (300x300 nm) regions of interest centred over intensity peaks.
Case study 1: bacterial motor proteins Courtesy of Howard Berg, Rowland Institute, Harvard University, USA: Leake et al. Nature 443, 355-8, (2006). GFP-MotB (E. coli) Courtesy of Keiichi Namba, Protonic Nanomachine Project, Osaka University, Japan
Antibody-tethered cell-rotation assay: d) e) (d) Brightfield and (e) TIRF images of GFP-MotB E. coli mutant. Black bar=1mm
Quantifying the number of fluorophores at the motor: MOT MEM Separate fixed fluorescence at motor (2D radial Gaussian) from diffusive non-motor fluorescence component in membrane (linear plane). ~22 MotB molecules in each motor complex
Focussed Laser FRAP/FLIP (…Loss In Photobleaching): Either track inidividual particles directly, or apply Monte-Carlo 2D simulations to estimate diffusion coefficient: Separating out motor and membrane components to measure turnover: Components in biological machines may need to be replaced frequently in much the same way as those for man-made machines Diffusion-to-capture model D ≈ 0.008 mm2 s-1 Stator dwell-time ~30s
Conclusions… • We observe step-like photobleaching of single GFP fluorophores in vivo • Can estimate in vivo concentrations of proteins to unprecedented accuracy • Able to measure mobility and turnover of proteins within a functioning membrane complex in a living cell in real-time to the same single-molecule precision
Case Study 2: Protein Translocation Across the E.coli Cytoplasmic Membrane Sec Tat Periplasm X Cytoplasm
substrate size range High potential iron protein 10.7 kDa Formate dehydrogenase 116 kDa Twin Arginine Translocation • Present in bacteria (Gram +ve and –ve) and chloroplast thylakoids • Important for virulence in e.g. Pseudomonas aeroginosa • Transport driven by the proton electrochemical gradient (Δp) • Transports proteins of variable dimensions (<20 to >100 kDa) across the cytoplasmic membrane of bacteria without rendering the membrane freely permeable to protons or other ions.
Components of E. coli Tat System periplasm N N TatB C C TatA N TatC C cytoplasm
C-face P-face Periplasm Cytoplasm ~110Å ~90Å ~100Å ~120Å TatA structures Single particle EM and random conical tilt reconstruction
MC4100 P tatA tatB tatC P P P P P P tatA-eYFP tatA-eYFP tatA-eYFP tatA-eYFP tatA-eYFP tatA-eYFP P P tatA tatA tatB tatB tatC tatC arab arab P tatB tatB tatB tatC tatC tatC P tatC Strain construction Strain Native operon λattachmentsite MC4100 λtatA-eYFP MC4100 λtatA-eYFP + pBAD(tatBC) JARV λtatA-eYFP BEAD λtatA-eYFP DADE λtatA-eYFP DADE λtatA-eYFP + pBAD(tatBC)
Typical images MC4100 (tatABC,λtatA-eyfp), epi MC4100arab (tatABC,λtatA-eyfp,+ pBAD(tatBC), epi DADE (DtatABC, λtatA-eyfp), epi DADEarab (DtatABC, λtatA-eyfp,+pBAD(tatBC)),epi epi 1 mm TIRF BEAD (DtatAB, λtatA-eyfp), epi 1 mm JARV (DtatA, λtatA-eyfp)
Tracking of fluorescent spots using “FIONA” Generate masks Fluorescence image Apply masks Autofind spots to generate ROIs Brightfield image Gaussian-weighted intensity mask each ROI to estimate intensity centroid Iterate Repeat for next ROI in frame Centre of spot intensity calculated to 5-10 nm precision (cf. optical resolution limit of ~250 nm) Next frame Use previous spot centres plus autofind new spots Terminate track No Does frame(i+1) spot agree with equivalent frame(i) spot in that?: Yes 1. Distance between centres < C pixels 2. Total intensities agree within T% 3. Spot widths agree within W% Yes Is frame(i+1) spot within A pixels of another spot of a different track? Extend track
Estimating number of YFP molecules estimate IYFP from step-wise photobleaching of pure YFP in vitro tracking of fluorescent spots in vivo periodicity of ~4-5 YFP cf. gels of TatA complex autocorrelate all tracks from same cell example track cf. IYFPin vitro = 790±100 counts Similar distributions if use either circularly or linearly polarised laser excitation Estimate YFP number for each track Photobleach correction
Measuring mobility and confinement Convert track Cartesian (x,y) of camera into curvilinear (xcell,ycell) using cell vital stats from masks tracks either “free” or “confined” rotate mean track vector to xrot axis Using only “free” tracks: Einstein-Stokes: D=kT/f Data suggest D ~1/Mw Consistent with oblate ellipsoid of diameter ~5-30nm cf. 5-12 nm for TatA complex alone from EM <r2> = 4Dt; “normal” 2D translational diffusion <r2> ~ta; a<1 “sub-” or “anomalous” diffusion
Conclusions 1. Location of TatA complexes is consistent with the cell membrane. 2. They require Tat A, B and C components to fully assemble. 3. TatA complex assembly does not require Dp. 4. They have a range of Mw consistent with a mean of ~30 protomers in a range 0-100 (cf. EM data of 19-31 protomer range) 5. TatA complexes exhibit anomalous diffusion behaviour. 6. If mobility of the complexes is confined, the typical confinement radius is ~100-200 nm. 7. There is evidence for diffusion along preferential angles. 8. Diffusion coefficients for “free” complexes vary over the range 0.005-0.095 mm2 s-1 as ~1/ Mw, consistent with oblate ellipsoid shape of diameter ~5-30 nm.
Acknowledgements: 1. Oxford Biochemistry: Jennifer Chandler, George Wadhams & Judy Armitage (MotB); Nick Greene, Ben Berks (Tat). 2. Oxford Physics: Richard Berry, Rachel Godun. 3. John Innes Centre, Norwich: Tracey Palmer. Advertisements: www.lsi.ox.ac.uk www.sysbiodtc.ox.ac.uk www.physics.ox.ac.uk/users/leake
Bibliography • Useful articles: • Axelrod D, Burghardt T P and Thompson N L (1984) • Total internal reflection fluorescence. Annu. Rev. Biophys. Bioeng. 13, 247–268. • Berg H C (2003) The rotary motor of bacterial flagella. • Annu. Rev. Biochem. 72, 19‑54. • Leake, MC. et al (2006) Stoichiometry and turnover in single, functioning • membrane protein complexes. Nature 443, 355-8. • Leake, MC. et al (2008) Variable stoichiometry of the TatA component of the twin-arginine • protein transport system observed by in vivo single-molecule imaging. PNAS 105, 15376-81 • Tsien, R. (1998) The green fluorescent protein. Annu. Rev. Bioch. 67, 509-44. • Useful websites: • http://www.olympusmicro.com/primer/techniques/fluorescence/tirf/tirfhome.html • http://www.physics.ox.ac.uk/users/leake • http://www.bionanotechnology.ox.ac.uk