Download
1 / 75
750 likes | 760 Views
Meeting the freight logistics challenge Presentation to the Portfolio Committee on Transport Maria Ramos Group Chief Executive Transnet Limited 2 August 2007. Structure. Context Freight system challenges What the NFLS says What Moving South Africa says Transnet’s view

E N D
Meeting the freight logistics challengePresentation to the Portfolio Committee on TransportMaria RamosGroup Chief ExecutiveTransnet Limited2 August 2007
Structure • Context • Freight system challenges • What the NFLS says • What Moving South Africa says • Transnet’s view • The freight demand model • Demand forecasts • The container value chain • How is Transnet responding to the challenges? • Turnaround Strategy • How has Transnet performed to date? • Progress on the turnaround strategy • Financial performance • Where will we focus going forward? • Integrated objectives • Infrastructure • Long term • 5 Year Plan
Efficient and effective freight logistics is critical to economic growth • Global economic liberalisation and advances in transport and ICT have given rise in recent years to high levels of global sourcing in many production systems • Imports by high-income countries from developing countries have risen from below 15 percent in the 1970s to nearly 40 percent today, and their share is expected to rise to more than 65 percent by 2030 (World Bank, 2006) • Supply chains have emerged as key competitive weapons as goods become increasingly commoditised • This requires our international supply chains to be globally competitive in terms of cost, speed, reliability, flexibility and reach Transnet is focused on delivering a world class integrated bulk freight logistics system that will provide local firms with a competitive advantage
The South African freight system is far bigger than Transnet Source: NFLS, 2005 This view of the system players ignores the very important role played by shipping lines
Structure • Context • Freight system challenges • What the NFLS says • What Moving South Africa says • Transnet’s view • The freight demand model • Demand forecasts • The container value chain • How is Transnet responding to the challenges? • Turnaround Strategy • How has Transnet performed to date? • Progress on the turnaround strategy • Financial performance • Where will we focus going forward? • Integrated objectives • Infrastructure • Long term • 5 Year Plan
What the NFLS says: The problem statement • The freight system in South Africa is fraught with: • Inefficiencies at system and firm level • Structural infrastructure shortfalls and mismatches • A lack of integrated planning • The skills base is deficient • Information gaps and asymmetries abound • The institutional structure of the freight system is inappropriate and • The regulatory frameworks are incapable of resolving the problems in the industry
Structure • Context • Freight system challenges • What the NFLS says • What Moving South Africa says • Transnet’s view • The freight demand model • Demand forecasts • The container value chain • How is Transnet responding to the challenges? • Turnaround Strategy • How has Transnet performed to date? • Progress on the turnaround strategy • Financial performance • Where will we focus going forward? • Integrated objectives • Infrastructure • Long term • 5 Year Plan
What MSA says: Key strategic challenges • Export competitiveness • Lack of alignment for value added exports • Barriers to cross border SADC traffic • System sustainability • High systems cost of domestic freight (externality costs) • Sustainability of the freight industry • High systems costs together with significant resource constraints, create a dynamic of a gradually deteriorating and eventually, financially unsustainable system
What MSA says: Lack of alignment makes it difficult to address the challenge • The system lacks proper alignment • There has historically been no institution or grouping of institutions with the function of integrating across the individual components of the system • Each component of the system has been managing to its own narrow objectives • Components of the system have therefore maximised against an unintegrated set of constraints and towards an unintegrated set of objectives South Africa has been unable to overcome this challenge An integrated Transnet can go a long way towards overcoming this challenge
Structure • Context • Freight system challenges • What the NFLS says • What Moving South Africa says • Transnet’s view • The freight demand model • Demand forecasts • The container value chain • How is Transnet responding to the challenges? • Turnaround Strategy • How has Transnet performed to date? • Progress on the turnaround strategy • Financial performance • Where will we focus going forward? • Integrated objectives • Infrastructure • Long term • 5 Year Plan
Transnet’s view of the freight system challenges • The challenges identified by the NFLS and MSA are valid • Transnet’s turnaround strategy is aimed at addressing these challenges • Transnet has identified additional challenges through the freight demand model and analysis of the container market
Freight demand model • The model was developed in August 2006 to assist with long term capacity planning • A first of its kind in South Africa • Modelling risk mitigated through stringent verification procedures which included: • Utilising multiple sets of economic forecasts • Comparing modeled flows against actual Transnet Freight Rail (previously Transnet Freight Rail) flows and outputs of SANRAL’s national freight flow model • Interviews with industry analysts, customers and supply chain experts to confirm forecasts and verify flows for the top 23 commodities comprising more than 90 percent of the total freight demand by weight • Model results were closely aligned with previous assumptions of long term demand for the ports
A pareto based combination was adopted. The modelling framework provided a economic structure which was then enhanced with empirical research for 90% of total GDP by weight. • Verify with: • Known flows • Rail data • National freight flow model Actual data – based on publications and personal interviews National I-O model Macro-economic data Apportionment - Supply and demand per commodity on a geographical basis Allocation - Flows per commodity Macro-economic forecast Commodity forecasts Parameters: 354 magisterial districts 95 commodity groupings The total output was compared to the national freight flow model (SANRAL) and strong correlation on corridor and rural flows confirmed a high degree of accuracy.
South Africa is a transport intensive economy Our long transport corridors is the key reason behind this abnormal demand Transport needs to be especially efficient to overcome this challenge Source: Supply Chain Management Centre, University of Stellenbosch
Structure • Context • Freight system challenges • What the NFLS says • What Moving South Africa says • Transnet’s view • The freight demand model • Demand forecasts • The container value chain • How is Transnet responding to the challenges? • Turnaround Strategy • How has Transnet performed to date? • Progress on the turnaround strategy • Financial performance • Where will we focus going forward? • Integrated objectives • Infrastructure • Long term • 5 Year Plan
Our structural problem with corridors will grow. Gauteng-Beitbridge (incl. Polokwane) Million tons 2006, 2011, 2016, 2021, 2026 Likely and high scenario Gauteng-Nelspruit (incl. Witbank) Gauteng-Lobatse Gauteng-Richards Bay Gauteng-Cape Town Gauteng-Durban Coastal Gauteng-East London Gauteng-PE Growth in the two major corridors can only be addressed with a sustainable intermodal solution
The continued absence of an intermodal solution has led to a sudden increase in South Africa’s truck fleet in an attempt to address freight owners’ door-to-door needs It is important to note that this increase has taken place after the release of the NFLS – the NFLS therefore did not take this into account Failure to address the corridor challenge will result in corridor gridlock Intermodal solutions provide the most efficient solution Source: NAAMSA data
Primary flows are completely rail orientated for obvious reasons Million tons 2006, 2011, 2016, 2021, 2026 Likely and high scenario Magnetite Domestic iron ore Export iron ore Export coal Domestic manganese Export manganese Capacity expansion should follow well developed systemic patterns Source: Centre for Supply Chain Management, University of Stellenbosch
Rural traffic in South Africa will pose growth challenges for the second economy Limpopo Million tons 2006, 2011, 2016, 2021, 2026 Likely and high scenario Mpumalanga North West Kwazulu Natal Northern Cape Free State Eastern Cape Western Cape This is primarily a road demand but rail solutions are possible where infrastructure is already installed Knowledge about rural traffic will facilitate branch line strategies.
In the likely scenario, total tonnage shipped will more than double in the next 20 years Total tonnage demand and shipped Likely scenario Coordinated action is required by all stakeholders to optimise the investment required to meet this demand Source: Centre for Supply Chain Management, University of Stellenbosch
.... and almost triple in the high scenario Total tonnage demand and shipped High scenario Source: Centre for Supply Chain Management, University of Stellenbosch
The economy will grow the fastest, by weight, in basic energy related commodities, basic earthworks, building related and food commodities Supply/Demand data:Growth in tons – 2006 to 2026 Source: Centre for Supply Chain Management, University of Stellenbosch
But when depicted as a % growth more beneficiated growth is expected Supply/Demand data:% Growth in tons – 2006 to 2026 Source: Centre for Supply Chain Management, University of Stellenbosch
Salient points • South Africa is a transport intensive economy • Freight demand will more than double in the next 20 years • The sudden increase in the truck fleet will lead to increasing congestion throughout the freight system • Future freight demand can best be met through the development of intermodal corridor solutions
Structure • Context • Freight system challenges • What the NFLS says • What Moving South Africa says • Transnet’s view • The freight demand model • Demand forecasts • The container value chain • How is Transnet responding to the challenges? • Turnaround Strategy • How has Transnet performed to date? • Progress on the turnaround strategy • Financial performance • Where will we focus going forward? • Integrated objectives • Infrastructure • Long term • 5 Year Plan
The container freight system • The container is the core of a highly automated system for transporting freight internationally • Almost all beneficiated goods are transported in containers • Maximising opportunities arising from the globalisation of production and supporting an export led growth strategy requires a world class container freight system Maritime connectivity and ocean freight rates are the main drivers behind the competitiveness of South Africa’s container supply chains
Distribution of costs across value chain Ocean freight is the biggest determinant of our container supply chain competitiveness
Comparison of supply chain costs At around 3,5 Million TEU, South Africa accounts for only 0.75% of the world container market and our market is dominated by two lines Source: Port of Singapore Authority, 2006
Structure • Context • Freight system challenges • What the NFLS says • What Moving South Africa says • Transnet’s view • The freight demand model • Demand forecasts • The container value chain • How is Transnet responding to the challenges? • Turnaround Strategy • How has Transnet performed to date? • Progress on the turnaround strategy • Financial performance • Where will we focus going forward? • Integrated objectives • Infrastructure • Long term • 5 Year Plan
Transnet vision and mission Transnet is a focused freight transport company delivering: Integrated, efficient, safe, reliable and cost effective services which help promote economic growth in South Africa INCREASED Market share IMPROVED Productivity and profitability PROVIDING Capacity for customers ahead of demand
Transnet values We are: Reliable Trustworthy Responsive Safe service provider TRANSNET’S CUSTOMERS PREFER US BECAUSE: OUR EMPLOYEES ARE: • Thinking • Disciplined • Results orientated • Ethical • Committed • Safety conscious • Accountable
Four-point turnaround plan Strategic intent Focused freight transport company Delivering efficient & competitive services Enabling economic growth Four-point Turnaround Strategy Redirecting and Re-engineering the Business Strategic Balance Sheet Management Ensure Corporate Governance & Risk Management Develop Human Capital • Improving efficiencies and effectiveness of core divisions • Realising port-rail synergies • Customer focus • Infrastructure and maintenance • Dispose all non-core activities and focus on core business units • Appropriate rate of return on invested capital (>WACC) • Post retirement funding • Optimise cash flow and cash management • Strategic asset/liability management • Highest standards of corporate governance • Improvement in risk management, especially safety in all operations • Revitalising HR by transforming culture and behaviour of staff • Be a preferred and sustainable employer • Focusing on: - Talent management - Leadership - Transformation - Performance and reward management
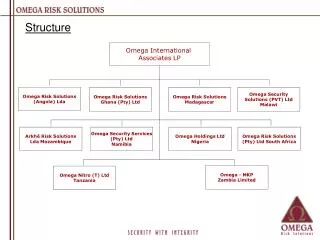
Structure to support strategy RAIL Transnet Freight Rail Transnet Rail Engineering TRANSNET COMPANY Operational divisions(continued businesses) Discontinued Businesses Discontinued businesses • SA Express • Transtel Telecoms • Viamax • Autopax • freightdynamics • Housing Loan Book • Shosholoza Meyl • Arivia.kom PORTS PIPELINE National Ports Authority Transnet Port Terminals Transnet Pipelines Supporting businesses: Property, Capital Projects
Structure • Context • Freight system challenges • What the NFLS says • What Moving South Africa says • Transnet’s view • The freight demand model • Demand forecasts • The container value chain • How is Transnet responding to the challenges? • Turnaround Strategy • How has Transnet performed to date? • Progress on the turnaround strategy • Financial performance • Where will we focus going forward? • Integrated objectives • Infrastructure • Long term • 5 Year Plan
Strategy implementation: achievements to date Capital investment to address infrastructure challenges On target with 2007 (R11,7 bn) roll out of five-year investment plan Replacement of assets (R8,2 billion) Expansion investments (R3,5 billion) Major projects commenced and spending next five years per Corporate Plan New Multi Product Pipeline (NMPP) from Durban to Johannesburg (R9,3 billion) Widening and deepening of the entrance channel at the Port of Durban (R2,6 billion) Ngqura Container terminal (capacity from 2010 onwards) (R6,1 billion) Coal line capacity expansion to 86 mtpa (R3,3 billion) Ore line expansion to 47 mtpa (R3,8 billion) Acquisition of 404 new locomotives (R4,9 billion) Project management: Establishment of Capital Projects Focus on: Co-ordination, implementation, skills, planning and delivery
Strategy implementation: achievements to date Disposal of non-core assets to refocus the business Businesses disposed Buyer Price South African Airways (Pty) Ltd (100%) Department of Public Enterprises R2 billion (no cash flow – transaction effected by share buy-back) V&A Waterfront Holdings (Pty) Ltd (26%) London & Regional Consortium R1.8 billion Transtel Telecom FSN Metro assets Neotel (Pty) Ltd (formerly the Second Network Operator) R250 million (funded by issue of equity of 15% in Neotel (Pty) Ltd via Transpoint Properties (Pty) Ltd) Equity Aviation Services (Pty) Ltd (49%) Equity Aviation Services (Pty) Ltd (and employee share scheme) R70 million VAE Perway (Pty) Ltd (35%) VAE SA (Pty) Ltd R30 million Transnet Pension Fund Administrators (100% - administration and investment services) Metropolitan Life (including Kagiso Trust Investments) and Fifth Quadrant respectively R20 million and R3 million, respectively
Disposal of non-core assets – Subsequent events Businesses Buyer Price “C” Preference share Newshelf 664 (Pty) Ltd R5,8 billion – Subject to certain conditions Viamax Pty Ltd (100%) Bidvest Ltd Approximate R1,0 billion • Subject to Competition Commission approval Transnet Housing Loan Book FirstRand Bank Ltd Fair value of R1,4 billion – Subject to Competition Commission approval Strategy implementation: achievements to date
Strategy implementation: achievements to date Achievements: Focus on: • Skills demand planning • Capacity building and skills development • Talent management Skills mapping completed Leadership development plans Prioritising skills and succession planning • Performance management SPO’s defined for all managers and performance assessed • Recruitment and retention Career planning and remuneration • Organisational culture Change management programmes in place Human capital development Additional capacity building 175 additional engineering bursaries 173 students at institutions of technology (to be increased to 300) 1 261 additional apprentices in different trades 20 Thuthuka bursaries through SA Institute of Chartered Accountants
Re-engineering the business: Vulindlela projects Second year of implementation Improve productivity levels and operational efficiencies Orientate businesses towards customers Address safety Culture of planned maintenance Increase in market share – volume growth (especially GFB in Transnet Freight Rail) Savings of more than R2 billion have been achieved since inception Success/achievements in 2007 Improved GFB freight flows (3 mt) Capacity created on Iron Ore and Coal Line that exceeds current demand from clients Increase in monthly port handling capacity at DCT (TEU’s 186 000 vs 158 000) Procurement savings of R500 million p.a. and reduction in safety incidents (R200 million) Strategy implementation: achievements to date
Strategy implementation: achievements to date Efficiency improvement: Transnet Business Intelligence projects (TBI) Implementation of TBI projects Effective use of technology, world class systems and processes Financial management and reporting Improving processes and systems that enable information management Identified KPI’s across businesses to measure key value drivers Benchmarking against international companies to ensure world class performance Implemented Key Performance Indicator project to measure: Key volume drivers KPI performance weekly/monthly Performance vs benchmarks – all areas of business
Strategy implementation: achievements to date Transnet Second Defined Benefit Fund (TSDBF) Active management and leadership from Transnet Currently in surplus of R1,9 billion as opposed to being in deficit in 2006 of R1,6 billion (aided by the sale of MTN shares-M Cell and V&A Waterfront) Rule amendments submitted to the Minister for approval Generally to enable bonus amounts to be paid to pensioners to exceed 2% pension increase (subject to affordability) Transnet to pay ex-gratia bonuses of R125 million to pensioners All to receive an additional 1% Previously disadvantaged widows and members with >15 years service who receive low pensions and/or also over 65 years old receive additional amounts
Transnet Pension Fund Act Amendment Bill Bill passed by Parliament enables non-Transnet employees of businesses transferred to other Government agencies to remain members – awaiting Presidential approval Rule amendments approved by Minister of Public Enterprises with the concurrence of the Minister of Finance Fund will become multi-employer with new employer guaranteeingobligations of its employees Fund now in substantial surplus (R1,1 billion) Strategy implementation: achievements to date
Economic Regulation National Ports Act Act in force from November 2006 Places responsibility on Transnet National Ports Authority to ensure safe, efficient and effective functioning of ports system Independent Regulator oversees Transnet National Ports Authority’s functions, approves tariffs, hears complaints and appeals from port users Transnet is investing in systems and capabilities to perform additional functions prescribed by legislation Interacting with shareholder on certain aspects of Act Pipelines NERSA (energy regulator), declined Transnet Pipelines’s application for 5,6% increase Methodology for pipeline tariffs not yet approved by NERSA Transnet engaging with relevant authorities; important that tariff methodology enables Transnet to earn a fair return on invested capital (> WACC) Strategy implementation: achievements to date Put in place a special committee to manage Regulation
Strategy implementation: achievements to date Risk Management Operational Risk Established a Risk Committee of the Board and appointed a Chief Risk Officer that serves on EXCO Appointed GE Human Resources and HR Sub-Committee dealing with human capital in sustaining the turnaround Improved safety measures and roll out safety awareness and training programmes Reviewed safety procedures and strengthened capacity in problematic areas Improved controls and campaign against fraud
Strategy implementation: achievements to date Risk Management Financial Risk Financial Risk Framework in place covering all risks (interest, currency, market) Asset and Liability Committee ensures that financial risks are effectively managed Stringent financial objectives are set to ensure that targeted financial ratios are achieved/maintained Improved internal financial and system controls
Transnet performance highlights: three-year view Measures 2004 Actual 2007 Compact 2007 Actual Improvementvs 2004 Performance vs Corporate Plan/Compact 2007 Operating profit R4 750 m R7 022 m R8 470 m 78% Exceeds compact by 21% EBITDA 17% 35% 40,7% 139% Exceeds compact by 16% Cash interest cover 3,5 times 5,3 times 5,4 times 54% Exceeds compact by 2% Cash flow return on investment (CFROI – real return) 4,0% 5,8% 6,8% 70% Exceeds compact by 17% Gearing 83% 48% 39% 53% Improvement against compact 19% Capex(excl. Aviation) R3,8 bn R11,8 bn R11,7 bn 208% Achieved 99% of budget (Target: >90%) Shareholders equity R9,9 bn – R37,4 bn 278% –
Structure • Context • Freight system challenges • What the NFLS says • What Moving South Africa says • Transnet’s view • The freight demand model • Demand forecasts • The container value chain • How is Transnet responding to the challenges? • Turnaround Strategy • How has Transnet performed to date? • Progress on the turnaround strategy • Financial performance • Where will we focus going forward? • Integrated objectives • Infrastructure • Long term • 5 Year Plan
for the year ended 31 March 2007 R million 2006 R million Revenue 28 214 26 034 Net operating expenses (16 726) (15 733) EBITDA 11 488 10 301 Depreciation and amortisation (3 018) (2 163) Profit on sale of interest in businesses, impairment of assets, dividends received and fair value adjustments 2 189 1 105 Profit from operations before net finance costs 10 659 9 243 Net finance costs (2 437) (2 406) Taxation (1 902) (2 042) Income from associates 2 33 Profit for the year from continuing operations 6 322 4 828 Profit for the year from discontinued operations 1 082 102 Profit for year 7 404 4 930 EBITDA margin (%) 40,7% 39,6% Financial results 2007 Consolidated income statement
Financial results 2007 Five-year EBITDA Margin Growth 86% growth 41 40 29 22 17