Download
1 / 2
20 likes | 148 Views
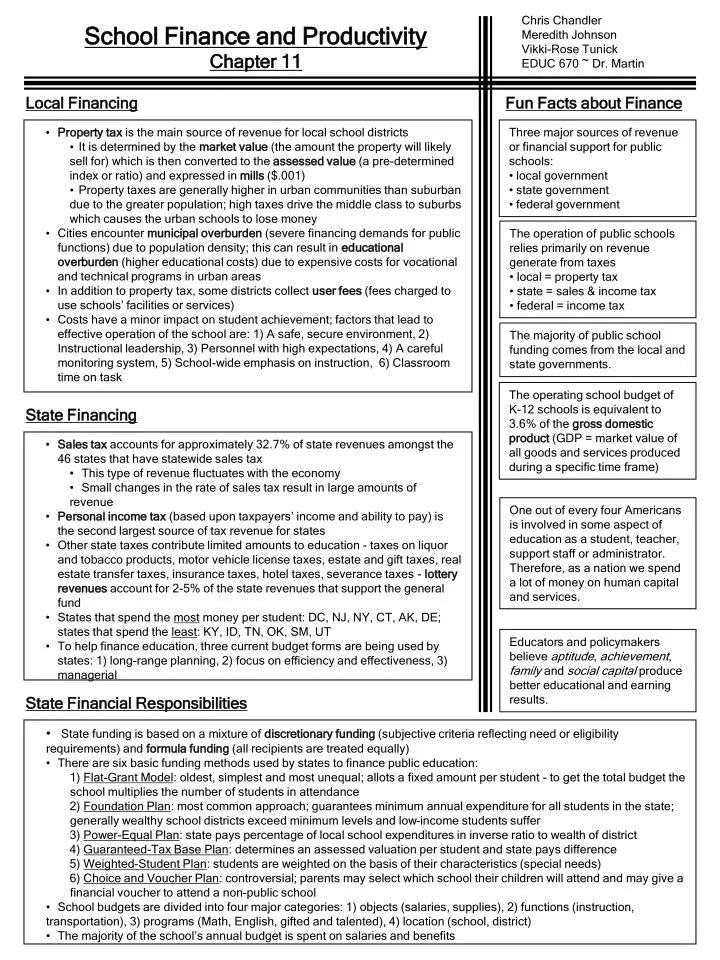
Chris Chandler Meredith Johnson Vikki-Rose Tunick EDUC 670 ~ Dr. Martin. School Finance and Productivity Chapter 11. Local Financing. Fun Facts about Finance. Property tax is the main source of revenue for local school districts

E N D
Chris Chandler Meredith Johnson Vikki-Rose Tunick EDUC 670 ~ Dr. Martin School Finance and Productivity Chapter 11 Local Financing Fun Facts about Finance • Property tax is the main source of revenue for local school districts • It is determined by the market value (the amount the property will likely sell for) which is then converted to the assessed value (a pre-determined index or ratio) and expressed in mills ($.001) • Property taxes are generally higher in urban communities than suburban due to the greater population; high taxes drive the middle class to suburbs which causes the urban schools to lose money • Cities encounter municipal overburden (severe financing demands for public functions) due to population density; this can result in educational overburden (higher educational costs) due to expensive costs for vocational and technical programs in urban areas • In addition to property tax, some districts collect user fees (fees charged to use schools’ facilities or services) • Costs have a minor impact on student achievement; factors that lead to effective operation of the school are: 1) A safe, secure environment, 2) Instructional leadership, 3) Personnel with high expectations, 4) A careful monitoring system, 5) School-wide emphasis on instruction, 6) Classroom time on task • Three major sources of revenue or financial support for public schools: • local government • state government • federal government • The operation of public schools relies primarily on revenue generate from taxes • local = property tax • state = sales & income tax • federal = income tax The majority of public school funding comes from the local and state governments. The operating school budget of K-12 schools is equivalent to 3.6% of the gross domestic product (GDP = market value of all goods and services produced during a specific time frame) State Financing • Sales tax accounts for approximately 32.7% of state revenues amongst the 46 states that have statewide sales tax • This type of revenue fluctuates with the economy • Small changes in the rate of sales tax result in large amounts of revenue • Personal income tax (based upon taxpayers’ income and ability to pay) is the second largest source of tax revenue for states • Other state taxes contribute limited amounts to education - taxes on liquor and tobacco products, motor vehicle license taxes, estate and gift taxes, real estate transfer taxes, insurance taxes, hotel taxes, severance taxes - lottery revenues account for 2-5% of the state revenues that support the general fund • States that spend the most money per student: DC, NJ, NY, CT, AK, DE; states that spend the least: KY, ID, TN, OK, SM, UT • To help finance education, three current budget forms are being used by states: 1) long-range planning, 2) focus on efficiency and effectiveness, 3) managerial One out of every four Americans is involved in some aspect of education as a student, teacher, support staff or administrator. Therefore, as a nation we spend a lot of money on human capital and services. Educators and policymakers believe aptitude, achievement, family and social capital produce better educational and earning results. State Financial Responsibilities • State funding is based on a mixture of discretionary funding (subjective criteria reflecting need or eligibility requirements) and formula funding (all recipients are treated equally) • There are six basic funding methods used by states to finance public education: • Flat-Grant Model: oldest, simplest and most unequal; allots a fixed amount per student - to get the total budget the school multiplies the number of students in attendance • Foundation Plan: most common approach; guarantees minimum annual expenditure for all students in the state; generally wealthy school districts exceed minimum levels and low-income students suffer • Power-Equal Plan: state pays percentage of local school expenditures in inverse ratio to wealth of district • Guaranteed-Tax Base Plan: determines an assessed valuation per student and state pays difference • Weighted-Student Plan: students are weighted on the basis of their characteristics (special needs) • Choice and Voucher Plan: controversial; parents may select which school their children will attend and may give a financial voucher to attend a non-public school • School budgets are divided into four major categories: 1) objects (salaries, supplies), 2) functions (instruction, transportation), 3) programs (Math, English, gifted and talented), 4) location (school, district) • The majority of the school’s annual budget is spent on salaries and benefits
Chris Chandler Meredith Johnson Vikki-Rose Tunick EDUC 670 ~ Dr. Martin School Finance and Productivity Chapter 11 School Effectiveness & Productivity School Finance Trends • There is debate whether the size of schools relate to the schools’ overall effectiveness; it is believed that: • Smaller schools - have high parental involvement and good school community relations, but may have underutilization of staff and curriculum • Larger schools - are more efficient and offer more diversified opportunities, but can suffer from a loss of personal contact or school identity • Oversized schools - can be detrimental to student achievement, particularly for low income children • There are several key indicators that reflect an effective school: • Emphasis on student achievement • Attitudes and levels of satisfaction among students, staff, parents, and community members • Clear academic goals • Order and discipline • Focus on learning • Tutoring programs for remediation • Teacher morale • Staff development • Administrative leadership • Community support ***Contrary to popular belief, money is not a key indicator Previous focus was on “equal education opportunity.” In today’s world, education is based on “excellence,” “efficiency,” & “productivity.” Budgets today are leaner and meaner and less and less is put aside for schools. In today’s economy, there is less real money available. As a result, school boards are being pressured to eliminate unnecessary spending in order to avoid tax increases. The following cost-reducing trends will continue: Class size will remain Modernize old buildings instead of build new ones Smaller schools (cheaper) Energy Economies Administrative Lay-offs Environmental Hazards • There are a number of environmental hazards affecting schools today: • Asbestos - kills an average of 25 people a year; children are most vulnerable; estimate of over $100 billion to clean up buildings • Radon - an invisible, odorless gas seeping in through soil and rock as well as water; the second leading cause of lung cancers; has been found in 54% of schools • Electromagnetic Fields - resulting from growing technology - radio, television, computers, microwaves, fluorescent lights, etc. • School Lead - prevalent in drinking water and accumulates in blood and bones; said to cause low IQ, language and reading incompetency, limited attention span, inability to follow instructions, behavioral impairment, cognitive, social, psychological and health problems; three-seven times higher incidence in low income areas • Indoor Air Quality - can cause sick building syndrome (SBS); thought to be caused by insulation due to energy-saving measures which results in limited outside air filtration Principals need to begin to do more in-depth analysis of the programming and staff development costs in order to budget more efficiently. Resources Hornbeck, M. (2003). What your district’s budget is telling you. JSD, 24(3), 28- 32. Lost. “Hurley winning the lottery.” (2009). Retrieved from http://www.youtube.co m/watch?v=dELZJy2OlSA School Infrastructure Costs and Construction Lunenburg, F.C. & Ornstein, A.C. (2008). Educational administration: Concepts and practices (5th ed.). Belmont, CA: Wadsworth / Thomson Learning. • School Infrastructure (physical facilities - plumbing, sewer, heat, electric, roof, masonry, carpentry) is deteriorating at a faster rate than most other public facilities • Experts believe schools need to allocate 3-5% annually for repairs and replacement; not as cost efficient to build new construction due to complexity and functionality of newer designs • Contributing factors to infrastructure costs: • Energy prices • Weather conditions • Density and Vandalism • Newer buildings (less quality) • Ticking Time Bomb (operating efficiency isn’t a priority) Zoolander. “Black lung, pop / bar scene.” (2011). Retrieved from http://www.y outube.com/watch?v=6ij0Jps wxjA