Download
1 / 1
10 likes | 149 Views
A Study of ATLAS Grid Performance for Distributed Analysis. S.Y. Panitkin, V. Fayn, T. Wenaus ( Brookhaven National Laboratory ) for the ATLAS Collaboration. Abstract. Grid job timing. Analysis jobs.

E N D
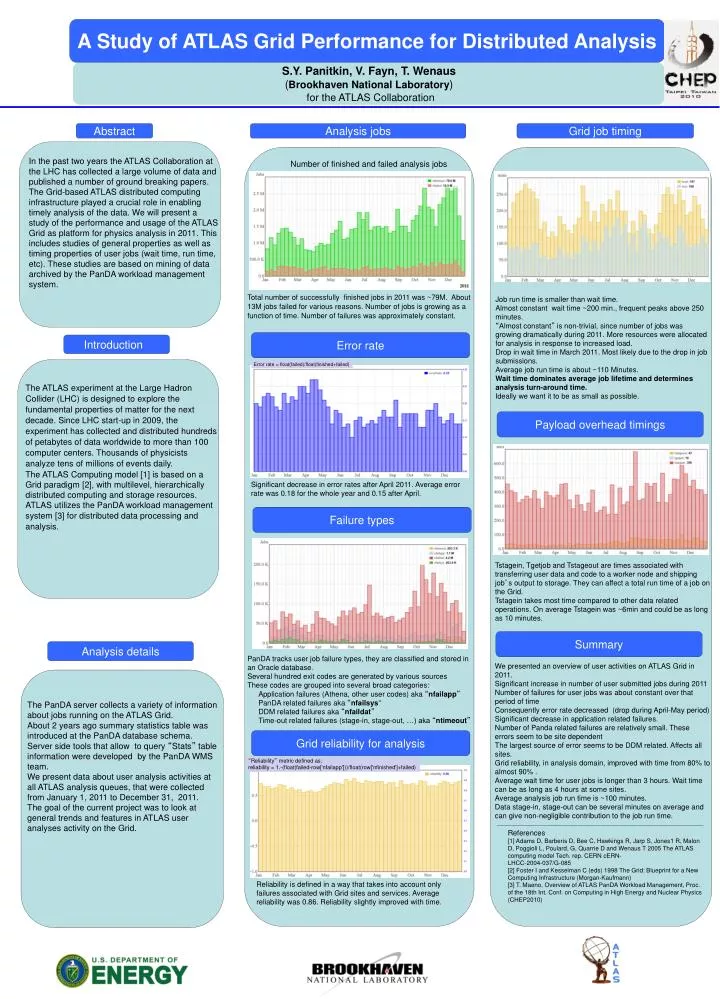
A Study of ATLAS Grid Performance for Distributed Analysis • S.Y. Panitkin, V. Fayn, T. Wenaus (Brookhaven National Laboratory) for the ATLAS Collaboration Abstract Grid job timing Analysis jobs In the past two years the ATLAS Collaboration at the LHC has collected a large volume of data and published a number of ground breaking papers. The Grid-based ATLAS distributed computing infrastructure played a crucial role in enabling timely analysis of the data. We will present a study of the performance and usage of the ATLAS Grid as platform for physics analysis in 2011. This includes studies of general properties as well as timing properties of user jobs (wait time, run time, etc). These studies are based on mining of data archived by the PanDA workload management system. Number of finished and failed analysis jobs Total number of successfully finished jobs in 2011 was ~79M. About 13M jobs failed for various reasons. Number of jobs is growing as a function of time. Number of failures was approximately constant. Job run time is smaller than wait time. Almost constant wait time ~200 min., frequent peaks above 250 minutes. “Almost constant” is non-trivial, since number of jobs was growing dramatically during 2011. More resources were allocated for analysis in response to increased load. Drop in wait time in March 2011. Most likely due to the drop in job submissions. Average job run time is about ~110 Minutes. Wait time dominates average job lifetime and determines analysis turn-around time. Ideally we want it to be as small as possible. Error rate Introduction Error rate = float(failed)/float(finished+failed) The ATLAS experiment at the Large Hadron Collider (LHC) is designed to explore the fundamental properties of matter for the next decade. Since LHC start-up in 2009, the experiment has collected and distributed hundreds of petabytes of data worldwide to more than 100 computer centers. Thousands of physicists analyze tens of millions of events daily. The ATLAS Computing model [1] is based on a Grid paradigm [2], with multilevel, hierarchically distributed computing and storage resources. ATLAS utilizes the PanDA workload management system [3] for distributed data processing and analysis. Payload overhead timings Significant decrease in error rates after April 2011. Average error rate was 0.18 for the whole year and 0.15 after April. Failure types Tstagein, Tgetjob and Tstageout are times associated with transferring user data and code to a worker node and shipping job’s output to storage. They can affect a total run time of a job on the Grid. Tstagein takes most time compared to other data related operations. On average Tstagein was ~6min and could be as long as 10 minutes. Summary Analysis details • PanDA tracks user job failure types, they are classified and stored in an Oracle database. • Several hundred exit codes are generated by various sources • These codes are grouped into several broad categories: • Application failures (Athena, other user codes) aka “nfailapp” • PanDA related failures aka “nfailsys” • DDM related failures aka “nfaildat” • Time-out related failures (stage-in, stage-out, …) aka “ntimeout” We presented an overview of user activities on ATLAS Grid in 2011. Significant increase in number of user submitted jobs during 2011 Number of failures for user jobs was about constant over that period of time Consequently error rate decreased (drop during April-May period) Significant decrease in application related failures. Number of Panda related failures are relatively small. These errors seem to be site dependent The largest source of error seems to be DDM related. Affects all sites. Grid reliability, in analysis domain, improved with time from 80% to almost 90% . Average wait time for user jobs is longer than 3 hours. Wait time can be as long as 4 hours at some sites. Average analysis job run time is ~100 minutes. Data stage-in, stage-out can be several minutes on average and can give non-negligible contribution to the job run time. The PanDA server collects a variety of information about jobs running on the ATLAS Grid. About 2 years ago summary statistics table was introduced at the PanDA database schema. Server side tools that allow to query “Stats” table information were developed by the PanDA WMS team. We present data about user analysis activities at all ATLAS analysis queues, that were collected from January 1, 2011 to December 31, 2011. The goal of the current project was to look at general trends and features in ATLAS user analyses activity on the Grid. Grid reliability for analysis “Reliability” metric defined as: reliability = 1.-(float(failed-row['nfailapp']))/float(row['nfinished']+failed) References [1] Adams D, Barberis D, Bee C, Hawkings R, Jarp S, Jones1 R, Malon D, Poggioli L, Poulard, G, Quarrie D and Wenaus T 2005 The ATLAS computing model Tech. rep. CERN cERN- LHCC-2004-037/G-085 [2] Foster I and Kesselman C (eds) 1998 The Grid: Blueprint for a New Computing Infrastructure (Morgan-Kaufmann) [3] T. Maeno, Overview of ATLAS PanDA Workload Management, Proc. of the 18th Int. Conf. on Computing in High Energy and Nuclear Physics (CHEP2010) Reliability is defined in a way that takes into account only failures associated with Grid sites and services. Average reliability was 0.86. Reliability slightly improved with time.