1 / 0

Spreadsheet Basics

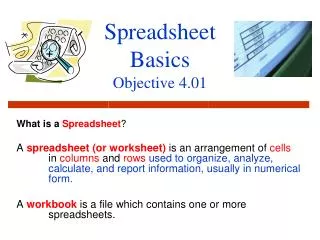
Spreadsheet Basics. What is a Spreadsheet ? A spreadsheet (or worksheet) is an arrangement of cells in columns and rows used to organize, analyze, calculate, and report information, usually in numerical form. A workbook is a file which contains one or more spreadsheets.

judson
Download Presentation

Spreadsheet Basics

An Image/Link below is provided (as is) to download presentation Download Policy: Content on the Website is provided to you AS IS for your information and personal use and may not be sold / licensed / shared on other websites without getting consent from its author. Content is provided to you AS IS for your information and personal use only. Download presentation by click this link. While downloading, if for some reason you are not able to download a presentation, the publisher may have deleted the file from their server. During download, if you can't get a presentation, the file might be deleted by the publisher.

E N D

Presentation Transcript


  1. SpreadsheetBasics

    What is a Spreadsheet? A spreadsheet (or worksheet) is an arrangement of cells in columns and rows used to organize, analyze, calculate, and report information, usually in numerical form. A workbook is a file which contains one or more spreadsheets.
  2. Spreadsheets Perform Mathematical Calculations Do you or your family use spreadsheets? Daily Uses of Spreadsheets: Balancing a checkbook Calculating car loans Calculating student grades (helping students keep up with their grades) Household budgets Why would a business use spreadsheets? Payroll Financial statements for a business (profit/loss)
  3. Designing a Spreadsheet Cell – individual locations on a spreadsheet (intersection of a row and column) Column— identified by letters of the alphabet (vertical) Column A refers to all of the contents in a vertical range of cells in the first column of the spreadsheet. Row— identified by numbers (horizontal) Row 3 refers to all of the contents in a horizontal range of cells on Row 3 COLUMNS (vertical) ROWS (horizontal)
  4. Cell Specifics Cell Range: A4:A16 refers to a group of adjacent cells A Range isa group/block of cells. example: A6:E16 refers to a range of cells in a specific spreadsheet. Cell Address: a specific location Cell A4 = Cell address It is the Column letter and Row number. The cell address is also called the cell reference. Active cell: The cell that is selected It is the cell that is ready to receive information
  5. Labels— the classification used for cells that contain text or for numbers that will not be used in calculations Examples: John Jones (text) Dates, such as 1/03/2009 (considered as text) Social Security # Phone # ZIP Code (a number, but will not be calculated) Using an apostrophe ‘ Type an apostrophe (‘) before a number to make that entry recognized as a label (the ‘ does not show when you press enter). Example: ‘27613 (Put ‘ so the ZIP Code is recognized as a label or text, not a value, by the computer) Cell Data Classifications
  6. Values— the classification indicating that the data has the potential to be used in calculations Example: 150 Cell Alignment for these classifications: Labels align at the leftside of the cell Values align at the rightside of the cell Cell Data Classifications
  7. Data Types Examples Formula Bar Value Formula Label
  8. Formatting Formatting is applied to spreadsheet components for the purpose of organizing and clarifyinginformation. Data that is presented in a uniform and consistentformat is much easier to understand than data presented with random formats. Formatting can be applied to pages, columns, rows, cell ranges, and cells.
  9. A Header/Footer Headers or Footers are used to add identifying information to a spreadsheet. May include: Title of company Date Page number Time of creation or update Contact information Footer Example
  10. Font Size and Style Font Size and Font Style are used to clarify information by adding emphasis to titles, column headings, and grand totals, etc. can also change font type and color Example: which title below is emphasized more? Title of Spreadsheet or Title of Spreadsheet
  11. Justification Justification is also used to format cell data for the purpose of clarifying and organizing information Left, Right, or Centerjustification can be applied globally to columns, rows, or cells. Indent is used to emphasize subcategories The Format Painter can also be used to apply global formats.
  12. Types of Justification Left Justification – Left is the default justification for cells formatted as Labels. Indent– Indent is a format applied to cell data to emphasize subcategories, such as the itemized list of expenses in a budget
  13. Types of Justification 3. RightJustification – Rightis the default justification for cells formatted as Values. Values should be formatted uniformly, such as, using two decimal places for all like data, or using currency for total amounts Ex. $500 vs. $500.00 Values can be formatted for a set number of decimal places with or without a comma separator. Ex. $1024.30 or $1,024.30
  14. [Right Justification (continued) ] Values can be formatted in a variety of date formats Ex. October 30, 2009 30 Oct 2009 10/30/09 d. Other formats for Values include time, percentage, fraction, and scientific
  15. Types of Justification 4. Center– Centering is a format usually applied to titles and column headings
  16. Justification Examples Centering of the Table Title LeftAligned (text) Column heading Listed Items RightAligned (values) Quantity Numbers with decimals (Prices)
  17. Borders and Shading are used to emphasize and organize information, and can be applied to columns, rows, cell ranges, or individual cells These lines are Borders! Reminder: select the columns, rows, or cells on which you want to apply Borders and Shading
  18. Adjusting Height, Width, and Size of Cells, Columns, and Rows Wrap text is used to align multi-line text within a cell. Mergeis used to combine two or more cells. Center is the default alignment when cells are merged.
  19. Adjusting Height, Width, and Size of Cells, Columns, and Rows Column Width Column Width is adjusted to fit the longest entry. Double click on the border between the 2 column heading When the ##### symbols appear in a cell, this indicates that the width is too small to display the contents.
  20. Sorts A Sort is used to arrangedata in alphabetical or chronologicalorder data can be sorted in Ascendingor Descending Order Examples of: Alphabetical order—Ascending A to Z Alphabetical order—Descending Z to A Numerical order—Ascending 1 to 10 Numerical order—Descending 10 to 1
  21. Sorts Primary sort – indicates the primary sort range of data (i.e., last name) also known as a single sort Secondary sort – indicates the next sort range of date (i.e., first name) also known as a multiplesort Examples of primary and secondary sort: Smith, Chris Smith, Ryan Stevens, John Can you answer this question?: Mr. Smith sorted the student athletes in order by GPA, last name, first name, and homeroom. GPA is an example of which part of the sort operation? _________________________
  22. Basic Spreadsheet Formulas Formulasinstruct the software to perform a calculation. All Formulas begin with an equal sign = When the equal sign [or in some cases a plus sign(+)] is keyed in a cell, the software “knows” that the data will be used in a calculation.
  23. Basic Spreadsheet Formulas Examples of basic formulas: if using Cells B7 and C7: Addition =B7+C7 Subtraction= B7-C7 Multiplication=B7*C7 Division=B7/C7
  24. Order of Operations Calculationsare performed according to the Order of Operations. (which means, they calculate in a specific order) To remember the Order Of Operations: remember PEMDAS—Please Excuse My Dear Aunt Sally Pparenthesesperforms operations on the items enclosed in (parentheses) first Eexponentiation ^ Mmultiplication * (from left to right) Ddivision / Aaddition + (from left to right) Ssubtraction -
  25. Order of Operation Example =(A8+C9)/(H8-L9) The parentheses around the first part of the formula force Excel to calculate (A8+C9) first. then calculate (H8-L9), then divide the 2 results. A8 = 10 C9 = 2 H8 = 7 L9 = 1 =(10+2)/(7-1) =12/6 =2 SOLVE!
  26. Functions Functions: is a short cut to performing a calculation or a formula All functions contain a word Start with an = sign just like a Formula Examples: SUM AVG MIN MAX IF COUNT LOOKUP DATE LIST
  27. Most commonly used Formulas SUM - Used for finding a total in a range of numbers AVG - Used to find the average in a range of numbers (add all numbers and divide by the #) MAX -Finds the largest # in a range MIN- -Finds the smallest # in the range
  28. Advanced Functions Advanced Functions are used in higher-level operations, such as conditional and comparisonequations to compute interest rates, due dates and payment terms, and financial projections.
  29. Types of Advanced Functions IF Statement Functions Date Functions Lookup Functions ListFunctions Count Functions
  30. IFStatements IF Statements are conditional operators. Results are returned IF the data specified in an equation meets conditions set by the formula IFstatements can be written to carry out an action Example: IF a value in a cell is greater than or equal to another value, insert the word “Pass” in a cell. Example: The answer is one value IF a condition you specify evaluates to TRUE and returns another value IFthe condition evaluates to FALSE.
  31. Date Functions DateFunctions are used to calculatea period of time. Types of DateFunctions: NOW– returns the current date (2) DATE360– calculates the difference in days between 2 dates Examples: The number of days that have elapsed since a value was entered into a specific cell To calculate a 30 day due date for a record of spreadsheet invoices
  32. Lookup Functions A Lookup function is used to compare a cell value to an ARRAY of cells and return a value that matches the location of the value in the array. (Note: the valuesMUST be placed in Ascendingorder) Types of LookupFunctions: (1) Lookup – used for two column vectors (2) VLookUp – used when there are more than two columns in the array (lookup table)
  33. List Function A List Function is used to: Assist in organizing spreadsheet information. Create a more user-friendly spreadsheet atmosphere. Control the size or content of data entries. Filter for specific content within a list.
  34. List Function Types of Lists: (a) Validated A validatedlistlimits data entry to specific choices programmed into the function (b) Non-Validated A non-validatedlistallows additional entries other than those provided in the drop-down menu. Example: displaying only the Southeast region vice presidents from a spreadsheet instead of displaying all of the vice presidents
  35. Count Function The COUNTFunction is used toreturn the number of cells in a range. Types of CountFunctions: Count – returns the number of cells in a rangethat contain numbers CountA – returns the number of cells in a rangethat contain any value/label Countlf – returns the number of cells that meet a condition set forth in a formula.
  36. Charts and Graphs used in Business Charts and graphs are used in business to communicate and clarify spreadsheet information A graph is a pictorial representation of data. It includes the plot area, gridlines, and values. A graph is used in a chart. A chart is an enhancement of a graph that includes labels, legend information, titles, and color and adds meaning to the graph. a chart emphasizes and categorizes the spreadsheet information into a format that can be quickly and easilyanalyzed.
  37. Examples of charts used in business Represent sales trends within different departments of a store Represent the contribution of individual employee sales to the total sales for a company Represent the percent of each expense to total expenses Analyze stock prices and explain the fluctuations to stakeholders
  38. Components of Graphs and Charts The y-axis is the left vertical side of the graph. It contains the numerical data. The x-axis is the bottom horizontal side of the graph. It contains the category information. Data markersare used in a graph to indicate data values. A data seriesis a collection of related values, such as one row or column from a spreadsheet. A gridline is a horizontal or vertical line that extends across the plot area of the graph for the purpose of adding clarification to the data. The plot areais the background portion of a graph. It is the area bound by the values (y) and categories (x) axes. A tick markis used in a graph to clarify data categories or values.
  39. Charts Chart A legend is an object that explains the symbols, colors, or patterns used to differentiate the data. A data labelis a single value or text explanation used to explain the data in a series. A chart titleis the main heading, which describes the purpose and content. The x-axis titledescribes the horizontal data. The y-axis title describes the vertical data. Embedded and linked An embedded chart is one that appears on the same sheet as the spreadsheet it represents; otherwise, it is referred to as a separate chart. A linked chart is one that will reflect changes made to the spreadsheet it represents.
  40. Common Charts Used in Business A column chart is used to make comparisons and generalizations about groups of data, such as to compare the number of students from each class (Sophomores, Juniors, and Seniors) to their attendance at assemblies. A stacked bar chart is used to represent the sum of more than one value and compare the contribution of individuals to the whole, such as the total sales for three components to the whole sales for a store. Aline chart is used to show trends or changes in data over time, such as growth in sales over several quarters. An XY scatter chart is used to show the correlation of two or more data sets, such as the correlation between stress rates and wait time in a doctor’s office. A pie chart is used to represent the contribution of each component of one series of data to the whole, such as the percentage of expenditures to the total budget. An exploded pie chart is a pie chart in which the individual components are enhanced.
  41. Types of Charts/Graphs
More Related