Download
1 / 15
150 likes | 262 Views
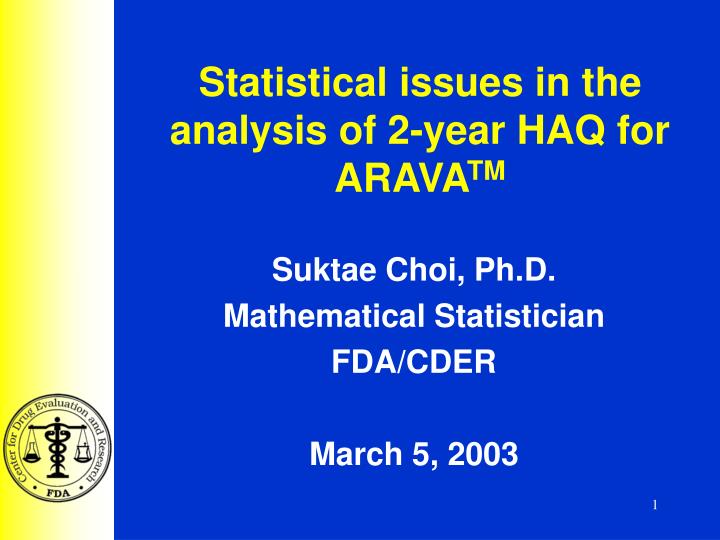
Statistical issues in the analysis of 2-year HAQ for ARAVA TM. Suktae Choi, Ph.D. Mathematical Statistician FDA/CDER March 5, 2003. Issues Presented. Problems of the statistical analysis for duration of 2 year clinical studies on ARAVA High rate of dropouts or missing data Early dropouts.

E N D
Statistical issues in the analysis of 2-year HAQ for ARAVATM Suktae Choi, Ph.D. Mathematical Statistician FDA/CDER March 5, 2003
Issues Presented • Problems of the statistical analysis for duration of 2 year clinical studies on ARAVA • High rate of dropouts or missing data • Early dropouts
Studies Reviewed • US Study (US301) • Lef vs. Pbo vs. Mtx • Randomized, parallel, double-blind • Followup for 2 years • At 16 wk, non-responders switched treatment • 2 European studies • MN301/303/305: Lef (vs. Pbo) vs. Ssz • MN302/304: Lef vs. Mtx
Efficacy AnalysisUS301 • Endpoints reviewed for year 2 • HAQ, MHAQ • Change from baseline at end of year 2 • Statistical analysis method • Last Observation Carried Forward (LOCF) • ANCOVA
: Lef : Pbo better worse Change from Baseline in HAQ at 2 years, US301 (p<0.001) LOCF Mean and 95% confidence Intervals, p-value: Lef vs. Pbo
: Lef : Pbo better worse Change from Baseline in HAQ at 2 years, US301 (p<0.001) (p=0.467) (p=0.023) LOCF Completers Imputed cases Mean and 95% confidence Intervals, p-value: Lef vs. Pbo
better worse Change from Baseline in HAQ at 2 years, US301 : Lef : Pbo :Mtx (p<0.001) (p=0.467) (p=0.023) LOCF Completers Imputed cases Mean and 95% confidence Intervals, p-value: Lef vs. Pbo
16 Percent of patients remaining in study for HAQ;US301 wk
Observed Cases wk HAQ change from baseline; ITT, US301 LOCF wk
Observed Cases 16 16 wk MHAQ change from baseline; ITT, US301 LOCF wk
Conclusions • Less than 30% of patients with a measurement of 2-year HAQ • With high rate of missing data, validity of 2-year analysis with imputation of year one data becomes problematic