Download
1 / 30
300 likes | 313 Views
Learn how to analyze and interpret financial statements to determine a company's ability to pay debt, reliance on financing, return on investment, profit margin growth, cost control, market trends, and more. Gain insights into liquidity and solvency measures, profitability analysis, and limitations of ratio analysis.

E N D
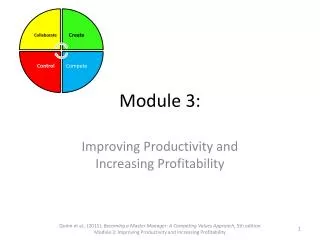
Module 3 Analyzing and Interpreting Financial Statements
Creditor Investor Manager Can the company pay the interest and principal on its debt? Does the company reply too much on non-owner financing? Does the company earn an acceptable return on invested capital? Is the gross profit margin growing or shrinking? Does the company effectively use non-owner financing? Are costs under control? Are the company’s markets growing or shrinking? Do observed changes reflect opportunities or threats? Is the allocation of investment across different assets too high or too low? Common Questions that F/S Analysis Can Help To Answer
Question? • Is a Net Income of $100,000 good?
Ratio Analysis • Examining various income statement and balance sheet components in relation to one another facilitates financial statement analysis. This type of examination is called ratio analysis. • This module focuses on the disaggregation of Return Measures into • Level I – RNOA and LEV • Level II – Profit Margins and Turnover • Level III – GPM, OEM, ART, INVT, APT, etc. • As well as Liquidity and Solvency Measures
Profitability Analysis • Return on Assets (ROA): ROA = Net Income / Average Assets • For example, if we invest $100 in a savings account yielding $3 at year-end, the return on assets is 3%.
Profit Margin, Asset Turnover, and Return on Assets for Selected Industries
Operating vs. Nonoperating • Operating expenses are the usual and customary costs that a company incurs to support its main business activities • Nonoperating expenses relate to the company’s financing and investing activities
Transitory vs. Core • Transitory items are one-time events (e.g., not likely to recur) • Core items are likely to recur (persist) and are, therefore, more relevant for company valuation
Return on Equity – Level 1 • Return on equity (ROE) is computed as: ROE = Net Income / Average Equity
Return on Net Operating Assets(RNOA) RNOA = NOPAT / Average NOA where, NOPAT is net operating profit after tax NOA is net operating assets
Financial Leverage and Risk • LEV is the other component of ROE • Is Debt a bad thing? • Given that increases in financial leverage increase ROE, why are all companies not 100% debt financed?
Gross Profit Margin • It allows a focus on average unit mark-ups • A high gross profit margin is preferred to a lower one, which also implies that a company has relatively more flexibility in product pricing.
Operating Expense Margin • Operating expense ratios (percents) are used to examine the proportion of sales consumed by each major expense category. • Expense ratios are calculated as follows: Operating expense percentage = Expense item/Net sales
Turnover • Turnover measures relate to the productivity of company assets. Such measures seek to answer the amount of capital required to generate a specific sales volume. • As turnover increases, there is greater cash inflow as cash outflow for assets to support the current sales volume is reduced.
Liquidity and Solvency Measures • Liquidity refers to cash: how much we have, how much is expected, and how much can be raised on short notice. • Solvency refers to the ability to meet obligations; primarily obligations to creditors, including lessors.