Download
1 / 49
500 likes | 747 Views
Fiscal Policy and Public Expenditure Santiago Herrera. PUBLIC EXPENDITURE ANALYSIS AND MANAGEMENT COURSE March 2005. Outline. I. The Government’s budget identity II. Expenditure: composition, efficiency and growth impact III. Taxes and growth-optimal size of the expenditure

E N D
Fiscal Policy and Public ExpenditureSantiago Herrera PUBLIC EXPENDITURE ANALYSIS AND MANAGEMENT COURSE March 2005
Outline I. The Government’s budget identity II. Expenditure: composition, efficiency and growth impact III. Taxes and growth-optimal size of the expenditure IV. Financing the budget-debt sustainability analysis in practice V. Policy coordination: fiscal, monetary, exchange rate and public debt policies
I. The Government’s Budget Identity Uses = Sources Uses : Sources:
Government’s Inter-temporal Budget Constraint Today’s debt stock = NPV of (primary surplus + seigniorage revenue) where
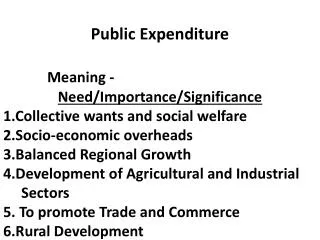
II. Public spending:composition, efficiency, and growth impact Objectives of public expenditure: Efficiency in resource utilization Economic growth Equity of income distribution and social stability • Cost-Benefit analysis • Measuring effciency • Growth impact
A. Costs Benefits Analysis • Rationale for public intervention • Redistribute income • Correct market failure/positive externality • Greater supply of goods than private-sector provision • Objectives and Targets • Valuing costs • Additional fiscal burden • Source of funds to cover costs – borrowing vs. taxation • Marginal cost of public funds • Sustainability – Macroeconomic Stability • Valuing benefits • Comparing with a counterfactual
Net present value of geothermal project in the Philippines with different marginal cost of funds
BOX 2: ROAMEF CYCLE Source: The Green Book, HM Treasury
B. Measuring Efficiency of Public Spending • Nonparametric Approaches: (Deterministic or Stochastic) • FDH (Free Disposable Hull) • DEA (Data Envelopment Analysis) • Parametric Approaches: (Deterministic or Stochastic) • Corrected OLS • Stochastic Frontier
Methodology: Concept of Efficiency • Technical Efficiency: TE = OR/OP • Allocative Efficiency: AE = OS/OP
Methodology: FDH • Input Efficiency for country B: XA/XB • Output Efficiency for country B: YB/YA
Methodology: DEA • Country C: Efficient by FDH, but inefficient by DEA • Peers of country C: A and D • Country D: inefficient by CRS DEA, but efficient by VRS DEA
An important factor of production (public spending) is used more intensively in the relatively richer countries Public Expenditure on Education and GDP per capita (both in logs)
C. Public Expenditure Composition and Growth Question – What’s impact of public spending composition on growth? • Re-allocation decisions among Infrastructure, Education, Health, and Transfers • Financing decisions for expenditure change – debt or tax, or or different types of tax instruments • Permanent vs. transitory expenditure changes
Modeling approach • Question: Effect of public expenditure on growth • Building blocks of the model economy based on some principles that allow replication of key features (growth, transfers, debt accumulation) • Experiments a. Allocation decisions: Change compositions and compare with SS b. Financing decisions: debt vs. taxes; or different types of tax instruments c. Permanent vs. transitory expenditure changes
Building blocks • Preferences (types of agents, consumption, unproductive government expenditure) • Technology- Explicit relationship between inputs and output; productive government expenditure) • Resource constraints (public and private sectors)
Building blocks (Glomm-Rioja)–Preferences • Consumer’s utility maximization problem Solution leads to optimal savings and labor supply decisions.
Building blocks-productive government expenditure • Human capital production function Laws of motion:
Building blocks-Fiscal policy where public expenditure (as % of GDP) • on infrastructure • on education • on transfers • on other non-utility enhancing public service Tax rate • on labor income • on capital (interest) income
Building blocks- The steady state • Competitive equilibrium conditions • The household utility maximization problem is solved. • The representative firm’s profits maximization problem is solved. • The government budget constraint is satisfied. • The goods market clears • The competitive input markets clear
Income per capita - Permanent Expenditure Reallocation (1% of GDP) Income in base year: $4500 for Brazil, constant 1995
III. How much government expenditure? a simple model and international comparison • The model (Barro and Sala-I-Martin, 1995) • Production function of the economy : Yt= AtF(K, N, G) or Y=AL1-KG1- • Government Budget constraint : G=Y • Representative individual maximizes a utility function subject to a budget restriction
Public expenditure has two opposite effects on growth rate of consumption of • One positive effect derived from larger government services • One negative effect due to the after-tax marginal product of capital
The simple estimate of the optimal size of government expenditure g
From this simple model we obtain: • The maximum growth rate is achieved for = G/Y=1- • Indicators of productiveness or unproductiveness of government services ( dy/dg>0 ?) • The degree of over-provisioning or under- provisioning of public capital Atf1< r+d+n
Implications of Maintenance in Public Capital • Aggregate Production Y=AL1-KG1- • Private capital • Public capital • Maintenance expenditure • New public investment • Government Budget constraint • Optimal tax rate that maximizes growth
Does government expenditure (as a ratio to revenue) conform to international experience?
The ratio between capital and current expenditures. Expenditure composition is a matter of concern
IV. Debt sustainability and productivity of capital expenditures • The traditional debt dynamics equation • Debt targeting- S instrument of fiscal policy • “Fiscal space”-productivity of public capital
Revised debt dynamics equation, with current and capital expenditures disaggregated r+d= rental price of public capital p = marginal productivity of public capital
Policy coordination: fiscal, monetary, exchange rate and public debt management- “fiscal space” considerationsunder liquidity constraints-Brazil 2002 • Features of Brazilian public debt • Mostly domestic • Short maturity and duration • Indexed to the exchange rate or to short term interest rates (Selic) • Concentrated holders (mutual funds, few banks)
Public debt jumps in 2001 as currency depreciates (Argentina crisis unfolding)
The primary surplus falls. The presidential campaign is no fertile ground for fiscal adjustments. Primary Fiscal Balance of the Public Sector 2000-2003 (as a percentage of GDP)
Brazilian Spreads and Exchange Rate Jan 2000 – April 2003 Capital Flows to Brazil (ratio to international reserves)
Net Resource Flow to Mutual Funds (as a fraction of net worth) Public debt sustainability concerns causes a run on mutual fund “deposits”
Money Base as a Share of GDP (seasonally adjusted data Monetary Impact of Treasury’s Operations 1999- 2003 (ratio to the monetary base The central bank was forced to print money toredeem public debt
Monthly Inflation Rate in Brazil 2000-2003 Seignorage from Money Creation 2000-2003 (% of GDP)
Exchange rate and interest rates adjust after the fiscal commitment is certain.