Download
1 / 73
730 likes | 861 Views
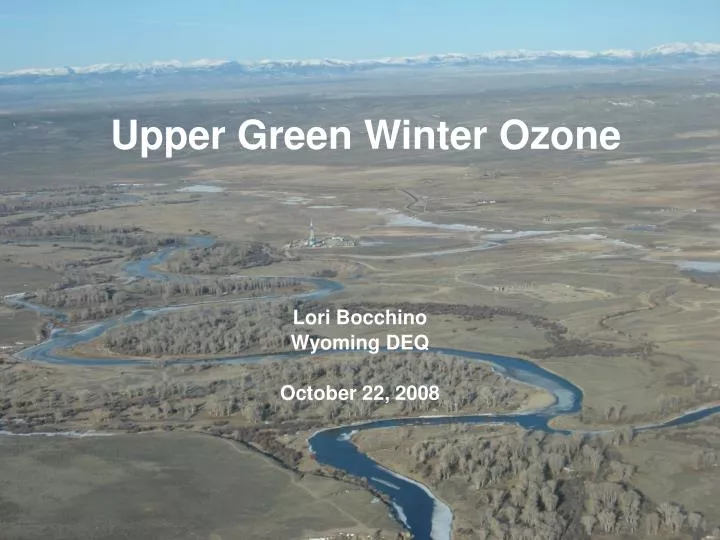
Upper Green Winter Ozone. Lori Bocchino Wyoming DEQ October 22, 2008. Presentation Overview. Background Field Study Overview Model Development What’s next. Warbonnet 20 Feb 2008. Background. Oil & Gas activity growth Historical ozone levels Unique features of SW WY ozone episodes.

E N D
Upper Green Winter Ozone Lori Bocchino Wyoming DEQ October 22, 2008
Presentation Overview • Background • Field Study Overview • Model Development • What’s next Warbonnet 20 Feb 2008
Background • Oil & Gas activity growth • Historical ozone levels • Unique features of SW WY ozone episodes
AQD Monitoring Site 4th high 8-hour ozone values (ppm) These sites have 3 complete years of data for 2005-2007
Unique Features of SW WY Ozone Episodes • Winter events • Low sun angle • Cold temperatures • Rural location • Low Population • No PSD major industrial sources • All Minor source oil & gas, compression • Limited mobile source activity?
Initial Theories • Monitoring error, possible interferences • Stratospheric Intrusion • Transport • Locally Formed Jonah 12:00 2/27/06 O3 conc. = 103 ppb
Upper Green Winter Ozone Study Field Study Overview
Field Study Objectives • Develop a more complete characterization of winter ozone events in the Upper Green River Basin • Provide data for • Development of a conceptual model of ozone formation • More accurate numerical simulations of high ozone events
Study Approach • Study design based on 2005 & 2006 high ozone event data • Identify meteorological and air quality modeling data requirements • Identify data needed to evaluate initial theories • Develop episode forecasting protocol • Conduct measurements February - March 2007 and mid-January – March 2008 • Continuous Measurements to supplement existing network • Intensive Operating Periods (IOPs)
UGWOS Continuous Sampling • Routine data collection at existing sites (Boulder, Jonah, Daniel South, Pinedale-CASTNET) • Airport operations • FRM O3 analyzer • Winds • Profiler Site (RWP) • Sfc winds, temp • RWP/RASS/SODAR (2007) • Mini-SODAR (2008) • Mesonet • Winds and ozone (Speedway, Big Piney and Mesa operated in 2007)
UGWOS IOP Measurements • Rawinsonde/ozonesonde at airport: 8:00, 11:00, 13:00, 17:00 • VOC/Carbonyl sampling • Three hour integrated samples at Jonah, Boulder, Daniel: 4:00 – 7:00, 9:00 – 12:00, 14:00 – 17:00 MST • Aircraft grab samples • Aircraft • Morning and afternoon flights • O3 (KI), PM2.5 (DustTrak) • Temperature, Pressure
Forecasting for IOPs • Used NWS models GFS and NAM • High Pressure Axis Approaching or Over Western Wyoming • Low Wind Speeds Aloft and at Surface • Warmer Temperatures Aloft • Colder Surface Temperatures • Strengthening Inversion • Significant Snowpack
Upper Green Winter Field Study Results
What is the background ozone concentration? • Operational definition of background: • What are ozone concentrations at CASTNet? • What are concentrations outside of study area during events? • What are concentrations inside study area when favorable conditions are not present? • 55 ppb
2007 Field Study Opportunities for Elevated Ozone • Meteorology did not set up as in 2005 and 2006 • Few opportunities for elevated levels • Saw episodes on 8-hour concentrations in low-to-mid 60 ppb • Called one IOP March 16-19
Notable events during 2007 • Lack of snow cover, local surface heating produced high temps during days resulted in deep mixing. • Mornings were calm but winds in afternoon were too strong to run tethered balloons and aircraft. • Collected data regarding UV radiation and reflection • Tracked microscale wind flow around the Basin • Analyzed VOC samples taken during IOPs • Big red balloons were too tempting for neighbors looking for target practice in off-season.
Snow Cover From: NOAA National Operational Hydrologic Remote Sensing Center Snow Depth 02-19-2008 (IOP #1) Snow Depth 02-19-2007
Photos from Boulder Visibility Camera Feb. 19, 2008 Feb. 19, 2007
Vertical Profiles and Mixing Heights • Inversions inhibit mixing
Role of Mixing Heights SODAR Mixing Height Daily Max 8-Hr Avg O3 at Boulder • Elevated O3 when MH < 150 m agl • Note mini-SODAR max range = 250 m agl
Ozone 18 – 21 February 2008 Boulder 122 ppb on 21 Feb
February 18, 2008 • Prevailing, strong winds from the NW • Well-mixed atmosphere • Regionally uniform ozone concentrations, with 8-hour averages from network sites less than 60 ppb
February 18, 2008 PM • Regionally low “baseline” ozone concentration of about 55 ppb
February 19, 2008 • High pressure over area • Stable surface layer • Significantly higher ozone concentrations reported by some network sites, including an 8-hour average of 80 at Jonah • Rapid development of high concentrations relative to clean conditions on February 18
February 19, 2008 • After initial NW winds in early morning, winds become regionally light and variable
February 19, 2008 AM • Airport profile shows strong surface inversion • Similar surface inversion of 10º to 15ºC were uniquely present during the mornings of all high ozone days
February 19, 2008 PM • Profile shows surface inversion with low wind speeds, restricting mixing • Higher ozone concentrations developing near surface
February 19, 2008 PM • High ozone concentrations in Jonah area • High concentrations well into foothills
February 20, 2008 • Continued high pressure, stable conditions • Ozone concentrations again develop over course of day • O3 > 75 ppb 8-hour avg. at Boulder, Daniel, Warbonnet, and Simpsons Gulch
February 20, 2008 • Continued mostly light and variable winds • Note afternoon winds in Jonah/Warbonnet area somewhat stronger and from the SE
Surface Winds, 20 Feb 2008 6:00 9:00 12:00 15:00 Times are MST
February 20, 2008 AM • Higher morning concentrations than previous days • No definitive areas of significant ozone carryover • Higher concentration over the New Fork river may be more a function of time (late in the flight)
February 20, 2008 PM • Vertical profiles show continued inversion, limited mixing, and “baseline” conditions above inversion Balloon Sounding at Pinedale Airport (Wenz Field) Aircraft Spiral Flight Pattern Sounding over Boulder
February 20, 2008 PM • Surface network misses high values W-SW of The Mesa • O3 peaks south of Jonah mid-afternoon consistent with NW morning winds switching to SE • O3 peaks NW of Jonah in late afternoon consistent with SE afternoon winds • Full spatial extent of high readings in southern portion of study area not well defined
February 21, 2008 • Continued high pressure, stable conditions • Ozone concentrations again develop over course of day • 8-Hour avg O3 > 75 ppb at all sites except Daniel and Cora • 8-hour average of 122 ppb recorded at Boulder – the highest for the year
February 21, 2008 • Continued mostly light and variable winds • Note afternoon winds at Warbonnet more southerly than previous days
February 21, 2008 AM • Again, no obvious ozone carryover from previous day, but ozone concentrations above “baseline”
February 21, 2008 PM • Peak concentrations at Boulder consistent with a Jonah source and southerly winds • High readings also noted in southern portion of study area – extent not well defined • Readings consistent with surface network data
March 11, 2008 PM • Highest readings recorded by aircraft during study, though beyond surface network coverage • Readings consistent with network-reported data (O3 > 75 ppb at Boulder, Jonah, Airport, and Haystack Butte, with Simpsons Gulch also high)
Summary of key finding from IOPs • Periods of high ozone characterized by stable conditions, surface inversion, low surface mixing height, and low surface winds • Polluted conditions can develop very quickly – within 24 hours of clean conditions • High ozone can occur anywhere in the study area; depending on meteorology • Southern extent of high O3 values not well characterized by these data
UV Radiation – UGWOS 2008 • Data quality issues with UV readings (out > in) • Loss of snow-reflected UV in mid-March
March 23, 2008 Flight • Though not conclusive, higher concentrations appear to correlate with areas of greater snow cover
Upper Green Winter Ozone Study Ozone Precursors