Download

1 / 44
440 likes | 536 Views
Vision-based World Modeling Using A Piecewise Linear Representation of The Occupancy Function. Dmitry O. Gorodnichy Department of Computing Science University of Alberta http://www.cs.ualberta.ca/~dmitri. Outline. World Exploration Problem: Tasks and Sensors Why Occupancy Approach? Problems:

E N D
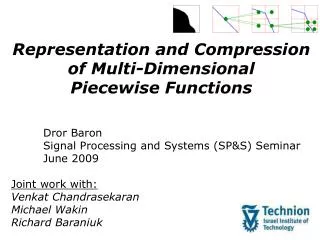
Vision-based World ModelingUsing A Piecewise Linear Representation of The Occupancy Function Dmitry O. GorodnichyDepartment of Computing ScienceUniversity of Alberta http://www.cs.ualberta.ca/~dmitri
Outline • World Exploration Problem: Tasks and Sensors • Why Occupancy Approach? • Problems: • Designing fast and affordable 3D sensor: • Visual sensor implementation & Calculating reliability values • Combining dependent range data • Representing the occupancy: • Memory consumption & Utility to application • Solutions • Putting into a framework. Conclusions.
World Exploration Task An agent equipped with range sensors is put in unknown environment. The agent tries to understand what is around it, by building a model of the environment, in order to accomplish a task. • Quality of the model is governed by: • the task the agent has to fulfill • the quality of the sensor
Types of World Modeling • Slow, but precise (NRC,ULaval): For virtual environments Cyber-cities, surgeries • Crude, but fast: In mobile robotics Exploring, finding objects A test-bed problem: “Find a hidden target (green triangle) in an unknown room by navigating and exploring”
Range sensors (Why Vision?) • Sonars (CMU,UMich,NCAR, …): slow, not for 3D acquisition • Laser-based (NRC,Laval, …, UofA): expensive and/or slow • Other: radars, lidars and infrared camera • Vision-based sensors (UBC,McGill,UBonn,CMU,UPenn, …): 1) Good for building 3D models and large scale models. • 2) Good for surveillance and recognition • 3) Fast* and affordable* • * Depends on the quality of the stereo system • (The more robust the stereo, the slower and/or more expensive it is)
Occupancy Approach • When sensor data are not reliable: Calculate the evidence that a point in space is occupied by building the Occupancy Function from excessive amount of data: • Range data are pairs: depth & confidence values
Occupancy Approach: background • To be used when • Sensors are not reliable • Different sensors are used • No geometry constraints can be implied • Environment is changing • Time is critical (e.g. in mobile robotics) • Previous work (1982-1998) • Moravec, Elfes, Thrun, Borenstein, Pagas, Payeur, Elsner
Occupancy approach: questions Vision-based occupancy modeling: Questions: • How to assign m to r ? (to observed point & other points) • How to build ? (to combine & represent) • How to use it ?
Visual Sensor Design • Previous work: • For occupancy modeling: UBC, CMU,UBonn, Shirai Lab, … • For geometry-based modeling: McGill, Bochum, INRIA, … • What do we want ? • Low-cost and fast 3D range sensor • To acquire data all around (but not too much of data) • Easy assignment of confidence values • What does it mean? • Using one off-the-shelf camera only • Avoiding long computations
Stereo Rig Design Where problems come from?
Camera and Images • What would you tell about the quality of this image? (Those are green rectangles on white wall as observes by a camera)
Camera and Images (cntd) • What would you tell about the distinctiveness of features? (Those are features selected for tracking in a 160 x 120 image)
Depth Calculation Details • RGB, 160 x 120 images, with no rectification • Projective geometry: focal length F=120 • Features: • Are tracked along vertical epipolar line (+/– a pixel) • Are those which are easy to track: Iy| > Ithresh • Marginal features discarded
Sensor model • Sensor model defines the evidence/probability that a point in space is occupied given a range sensor measurement : Questions: • How to calculate this value for the observed point ? • How to calculate this value for neighbouring points ? • Using evidential approach allows one to calculate these values using the reliability parameters of the sensor.
More on Evidential Theory • Operates with both occupancy and emptiness evidence: m(o) and m(e), which are initially set to zero. • Accumulates them independently. • Provides Belief and Plausibility measures: Bel = m(o) Pl =1– m(e) Advantages: • Allows to use sensor error analysis in calculating the evidence of range data. • Resolves "contradictory vs unknown" ambiguity (when m=0.5), by providing an interval of uncertainty [Bel;Pl]
Sonar Sensor model • Probabilistic approach: P(occ) = 1 – P(emp) • Evidential approach: On the arc: m(occ)=1/N, m(emp)=0 In sector: m(occ)=0, m(emp)=1/S Elsewhere: m(occ)=0, m(emp)=0
Visual Sensor model • Where uncertainty comes from ? • From the limitations of the camera • From the complexity of the environment • What are parameters that determine the reliability of data ? • Feature match error • Depth calculation error
Single Camera Sensor Model Ideal camera: Real camera:
Stereo Error Analysis • Quantization error gives: • Match error E gives:
Image,Features & Range Data (The brighter a range point, the higher its evidence)
Image,Features &Range Data From another robot location:
Complete Scan of a Room • It takes ~1 min : • two pairs of grabbed images in each of 15 camera pan positions.
Combining Evidence • Fusion Problem: - According to one measurement “point A is non-occupied”: • - According to another “point A is most likely occupied”: • So, is the point occupied or not ? • How sure are we in the answer ? • General situation: Measurements describe not the same point, but neighboring points.
Conventional Approaches • Probabilistic approach: Bayesian rule (requires knowledge of conditional probability tables) • Evidential approach: Dempster-Shafer rule (assumes DS-independence)
Assumption of Independence • In practice simplified rules are used (ULaval): These rules however cannot be applied for dependent range data! Example (from real experiment): The same unreliable feature is observed twice by the cameram1 = 0.6 & m2 = 0.6 result in m1+2 = 0.7 • Other combination rules need to be investigated!
Fusion as Regression Given a set of sample points from a sensor, find a function such that minimizes the error • Offers a rule for combining dependent and adjacent data • Requires evidential approach (probability axioms no longer hold) • Questions: • How to incorporate sensor model? • Which regression technique to use?
Incorporating Sensor Model Each feature induces a set of features according to the sensor model Use it! • Choose coordinate system - To be convenient for 1) the application, and 2) sensor model • Choose constraints - To suit well 1) sensor model, and 2) the application • Generate sample points just enough.
Rule-based vs Regression-based • Conventional approach: Number of points depends on the scale • Regression based approach approach: 3-5 points are enough (scale invariant)
Choosing Regression Technique Two factors to take into account: • Factor 1: The quality of range data • Robust regression (LMS, WLS) - deal with outliers • Least Squares estimators – fast, but not good on outliers • Factor 2: The use of the constructed model • Linear functions are easy to invert. • Linear functions are easy to constrain.
Adaptive Logic Network ALN – Least Squares multiple Linear regression technique
Experiments • Terms of experiments: • Environment – large-scale, full of visual features. • Range data – obtained by a single camera sensor. • Regression – ALN-based. • Goals of experiments – to observe the problems: • How are planar objects modeled in a radial-based system? • How much time and memory does it takes to model? • Is the quality good enough for planning navigation?
Experiments (Simulated Data) • Empty rectangular room: L=46 • Cylindrical room with object: L=150 (Error=0.15)
Experiments (Real Data) • The precision of modeling is determined by the number of linear pieces used in regression: L=8 L=16 • Problems observed: • LS and outliers • Discontinuity of the models • Lack of features • Visualization problem
Representing the Occupancy • Conventional grid representation of m=F(x,y,z) requires storing and processing huge 3D arrays of data Solution: Parametric representation. • Any function can be represented using linear equations: Questions: • How to calculate surface equations ? - Use regression. • How to extract navigation maps from them?
Extracting maps 1. Obtain the inverse (which is possible due to the monotonicity constraint): 2. Apply at different heights h, shrink and take the intersection • The obtained polygon can be used in navigation planning.
Planning Navigation • Use Reinforcement Learning or Potential Fields approach. • Reinforcement of actiona(where to go)taken at stateS(of the robot and environment)isr(S,a) = rgoal + rexploration+ robstacles • Obstacle points repel: robstacles < 0 • Goal and exploration points attract: rgoal > 0, rexploration> 0 • Optimal navigation policy p maximizes the total discounted reinforcement defined by the Value Function: • Value Function of the optimal policy satisfies Bellman’s equation:
Planning Navigation (cntd) • Obstacle and exploration points are extracted from the maps: • Value function is calculated using ALN-based reinforcement learning.
Putting it together ``Explore an environment with a video-camera'' • Explore environment (e.g. to locate an object) by • planning intelligently navigation using • compact and convenient models constructed by • combining uncertain dependent range data • registered by an affordable and fast 3D range sensor.
Robot Boticelli • Probabilistic
From Image Processing to Navigation planning Movie 1: From 2D features to 3D depth map to 3D occupancy models to 2D navigation polygons. Movie 2: Looking for the target in unknown environment.
Conclusions • The problems of occupancy modeling identified. • Evidence-based visual sensor model is developed (allows one to use an off-the-shelf video-camera). • Regression-based range data fusion technique is developed (allows one to combine dependent data). • Methods for building and using parametric occupancy models (require little memory and yield efficient map extracting). • Framework established. Major problems identified. • Further improvements shown.
Directions for Further Improvement • Better range data: • Better cameras, better calibration, image rectification; • Better feature selections, robust tracking • Other range sensors (e.g. laser range, infrared scanners) • Other regression and neuro-computational techniques • Belief Occupancy in addition to Plausibility Occupancy • Combine several models into one model • Work on improving the accuracy and apply to other exploration tasks (e.g. building virtual environments, robot localization, tele-robotics, texture mapping)
Acknowledgements • This research was partially supported by the Defense Research Establishment Suffield. • The ideas of using piecewise linear surfaces for occupancy function approximation and using only one camera for 3D data acquisition were initially suggested by W.W. Armstrong. • Thanks to employees of Dendronic Decision Limited, Edmonton, Canada:Kyle Palmer, Monroe Thomas, Brant Coghlan and Ron Kube. • The influence of Sandro Botticelli and other artists of the Renaissance, the cultural movement concerned with the multifaceted development of a human being, is acknowledged as well.
Image,Features &Range Data From another robot location: