Download
1 / 38
380 likes | 570 Views
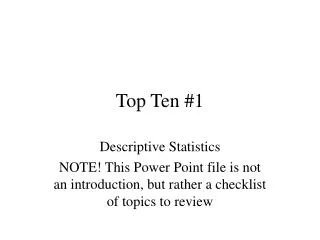
Topics: Descriptive Statistics. A road map Examining data through frequency distributions Measures of central tendency Measures of variability The normal curve Standard scores and the standard normal distribution. The Role of Description. Description as a purpose of research

E N D
Topics: Descriptive Statistics • A road map • Examining data through frequency distributions • Measures of central tendency • Measures of variability • The normal curve • Standard scores and the standard normal distribution
The Role of Description • Description as a purpose of research • Choosing the right statistical procedures
Frequency Distributions • A method of summarizing and highlighting aspects of the data in a data matrix, showing the frequency with which each value occurs. • Numerical Representations: a tabular arrangement of scores • Graphical Representations: a pictorial arrangement of scores
Numerical Frequency Distributions • Ungrouped Frequency Distributions • Grouped Frequency Distributions • Relative Frequency Distributions • Cumulative Frequency Distributions
Tabular Frequency Distributions Single-Variable (“Univariate”)
Frequency Distribution: Major MAJOR Valid Cum Value Label Value Frequency Percent Percent Percent PHYSICS 1.00 5 12.5 12.5 12.5 CHEMISTRY 2.00 4 10.0 10.0 22.5 BIOLOGY 3.00 7 17.5 17.5 40.0 ENGINEERING 4.00 5 12.5 12.5 52.5 ANTHROPOLOGY 5.00 5 12.5 12.5 65.0 SOCIOLOGY 6.00 4 10.0 10.0 75.0 ENGLISH 7.00 7 17.5 17.5 92.5 DESIGN 8.00 3 7.5 7.5 100.0 ------- ------- ------- Total 40 100.0 100.0 Valid cases 40 Missing cases 0
Frequency Distribution: Major Group MAJORGRP Valid Cum Value Label Value Frequency Percent Percent SCIENCE & ENGINEERIN 1.00 21 52.5 52.5 52.5 SOCIAL SCIENCE 2.00 9 22.5 22.5 75.0 HUMANITIES 3.00 10 25.0 25.0 100.0 ------- ------- ------- Total 40 100.0 100.0
Frequency Distribution: SAT SAT Valid Cum Value Frequency Percent Percent 1000.00 2 5.0 5.0 5.0 1025.00 1 2.5 2.5 7.5 1050.00 2 5.0 5.0 12.5 1060.00 1 2.5 2.5 15.0 1075.00 1 2.5 2.5 17.5 1080.00 1 2.5 2.5 20.0 1085.00 1 2.5 2.5 22.5 1090.00 2 5.0 5.0 27.5 1100.00 7 17.5 17.5 45.0 1120.00 2 5.0 5.0 50.0 1125.00 3 7.5 7.5 57.5 1130.00 1 2.5 2.5 60.0 1150.00 5 12.5 12.5 72.5 1160.00 2 5.0 5.0 77.5 1175.00 3 7.5 7.5 85.0 1185.00 1 2.5 2.5 87.5 1200.00 5 12.5 12.5 100.0 ------- ------- ------- Total 40 100.0 100.0 Valid cases 40 Missing cases 0
Graphical Frequency Distributions • Bar Graphs • Histograms • Stem and Leaf • Frequency Polygons • Pie Chart
Graphical Frequency Distributions:Single-Variable (“Univariate”)
Stem and Leaf: SAT SAT Stem-and-Leaf Plot Frequency Stem & Leaf 3.00 10 . 002 8.00 10 . 55678899 13.00 11 . 0000000222223 11.00 11 . 55555667778 5.00 12 . 00000 Stem width: 100.00 Each leaf: 1 case(s)
Graphical Frequency Distributions Two-Variable (“Joint” or “Bivariate”)
What Can Be Seen in Frequency Distributions • Shape • Central Tendency • Variability
Descriptive Statistics • Central Tendency • Mode • Median • Mean • Variability • Range • Standard Deviation • Variance
Definitions: Measures of Central Tendency • Mean: • “Arithmetic mean” • “Center of gravity” such that the “weight” of the scores above the mean exactly balances the “weight” of the scores below the mean • Median: • The number that lies at the midpoint of the distribution of scores; divides the distribution into two equal halves • Mode: • Most frequently occurring score
Definitions:Measures of Variability • Range: • Difference between highest and lowest score • Inter-quartile Range: • The spread of the middle 50% of the scores • The difference between the top 25% (Upper Quartile-Q3) and the lower 25% (Lower Quartile-Q1) • Standard Deviation: • The average dispersion or deviation of scores around the mean (measured in original score units) • Variance: • The average variability of scores (measured in squared units of the original scores (square of the standard deviation)
Range, Interquartile Range, and Standard Deviation: SAT Scores by Area
Range, Interquartile Range, and Standard Deviation: SAT Scores by Gender
Properties of Normal Distribution • Bell-shaped (unimodal) • Symmetric about the mean • Mode, median, and mean are equal (though rarely occurs) • Asymptotic (curve never touches the abscissa)
Normal Curve Areas Under the Curve .3413 .3413 .1359 .1359 68% .0214 .0214 95% .0013 .0013 99% -3s -2s -1s +1s +2s +3s X
Definitions: Standard Scores • Standard Scores: scores expressed as SD away from the mean (z-scores) • Obtained by finding how far a score is above or below the mean and dividing that difference by the SD • Changes mean to 0 and SD to 1, but does not change the shape (called Standard Normal Distribution)
Uses of Standard Normal Distribution • What proportion of scores falls between the mean and a given raw score • What proportion of scores falls above or below a given raw score • What proportion of scores falls between two raw scores • What raw score fall above (or below) a certain percentage of scores