Download
1 / 26
260 likes | 447 Views
February 8, 2012. Damage loss estimation of the 2011 Japan tsunami: A case study. Naresh N Spatial Modelling Group RMS India Pvt. Ltd., Noida. Co-authors : Priya Logakrishnan, Avnish Varshney, Sreyasi Maiti, Edida Rajesh. Agenda. Background Study Area Data Used Methodology

E N D
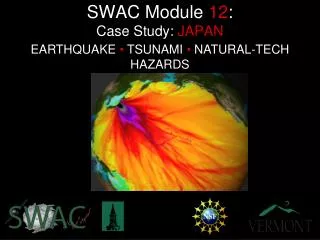
February 8, 2012 Damage loss estimation of the 2011 Japan tsunami: A case study Naresh N Spatial Modelling Group RMS India Pvt. Ltd., Noida Co-authors : Priya Logakrishnan, Avnish Varshney, Sreyasi Maiti, Edida Rajesh
Agenda • Background • Study Area • Data Used • Methodology • Delineation of Tsunami extent • Developing building footprint • Validation & Results • Conclusion
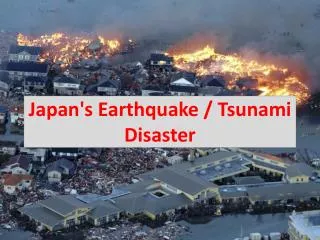
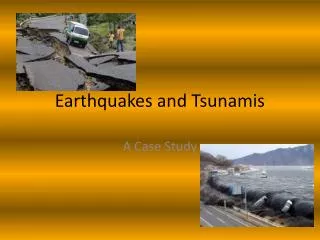
Background • Earthquake of 8.9 magnitude struck off the north coast of Tohoku, Japan (Mar’11) • Triggered Tsunami over entire east coast of ~20ft • Huge losses in terms of human lives, built-up urban areas, agricultural fields, and forested areas • Scope of the study area • To estimate the first cut losses and affected region which help modellers\scientist for further management • Delineating the affected region • High resolution data – building level information
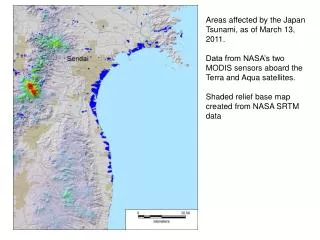
Study Area • Tohoku, Japan Tsunami • Coastal stretch of Ishinomaki to Sendai of Miyagi prefecture • Stretches about 70 Km from north to south of east coast of Japan with tsunami inundated region Building
Data Used • Tsunami delineation • Remote sensing Images - MODIS Image (250m & 500m) • Pre event image (dated 23rd Feb 2011) • Post event image (dated 12th Mar 2011) • Developing the building level inventory • Using various open source data • GSI (Geospatial Information Authority of Japan) for major city extent • Open street map (OSM) • Google Earth utilities and Emporis# website are used as references for estimating the quality of the available building footprints # (http://www.emporis.com/country/japan)
Methodology • Delineating the Tsunami Area • Change detection algorithm using multi-temporal data • Image registration • Radiometric Normalization • Histogram matching# algorithm is applied to normalize the radiometric affects • Change Vector Analysis (CVA) method is applied
Methodology • Change Vector Analysis • Magnitude and direction - change algorithm is used to identify the impacted region • Two time point images, with two bands only, pixel of time1 image (pre) and time2 images (post) • Magnitude of the change vector • Where date1 and date2 can be denoted by (a1, b1) and (a2, b2) respectively • Direction of change θ • 𝛼 is angle of change and aiand biare the spectral response of pixels in band 1 & 2 • Kernel based thresholding algorithm is used after computing the magnitude of the change vector to find change and no-change region • Cleaning and gap filling methods are applied to extract the Tsunami extents using ArcGIS
Methodology • Developing Building Footprint in the Impacted Region • GSI building level data • Region - Sendai and Ishinomaki • OSM data • For remaining region • Building selected • Noise correction
Methodology • Large amount of building footprints • Assigning the building inventory (like number of floors and lines of business – Residential, Commercial & Industrial) • 5 ×5 kilometre grid
Methodology Building data from GSI & OSM Building data over GoogleEarth Road block data Defined Process • 0.17 million buildings • 4 days with 5 resources GSI RS Street View from GoogleEarth for validation
Methodology • Each grid is further divided based on road block level • Commercial & Industrial are assigned to respective building • Tall rise building • Reference • Google Earth • Emporis website
Methodology • Combined building footprint after cleaning and inventory assigning • Area calculated for each footprint using ArcGIS • Total building area • Total Area = Area of building × Number of floors • Total cost of the building • Building Cost = Total area × Cost per square meter • Total loss • Aggregated Loss = ∑ Building Cost
Validation & Results • Tsunami inundated region and building footprints are validated by over laying spatial layers on Google Earth • Building footprints and attribute information are almost matching with the reference images • Removed duplicate building (if any)
Validation & Results • Using the above equations, aggregate losses were computed • $60 billion to $74 billion (based on min and max coast value) • Figures are representing the structure loss only Source: http://www.mlit.go.jp/en/index.html
Conclusion • Losses computed using MODIS multi-temporal images and digital building footprints • Study helps to compute the first cut losses/damage for disaster management within a short time frame after event • If accurate building footprints are available for a region, one can compute damage/impact cost more accurately.