Download
1 / 5
50 likes | 168 Views
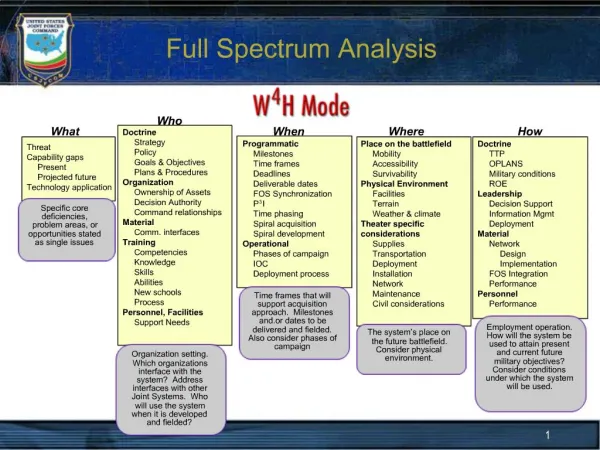
SBU Dark Spectrum Analysis. Daniel Ruterbories Colorado State University. Dark Noise Correlation 0.5PE. SBU vs CSU Darknoise 0.5PE. Suspected fit failures or test setup failure mode. Still has a nice correlation if the three outliers are removed. SBU vs CSU Peak to Peak Separation.

E N D
SBU Dark Spectrum Analysis Daniel Ruterbories Colorado State University
SBU vs CSU Darknoise 0.5PE Suspected fit failures or test setup failure mode Still has a nice correlation if the three outliers are removed
SBU vs CSU Peak to Peak Separation • Width corresponds to 1 degree variation in temperature • Expected peak at 25 degrees C at 11-12 ADC • Suggests SBU data taken at a temperature of 20-25 degrees C
Acknowledgments • Thank you to the SBU crew for taking this SuperP0D data