Download
1 / 42
1k likes | 2.14k Views
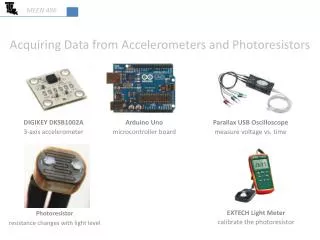
Accelerometers. Justin Piccirillo Texas Instruments Incorporated Sensors & Controls Division jpiccirillo@ti.com. Summary. Definition of Acceleration Technologies Texas Instruments - Capacitive Acceleration Sensor (CAS) Terminology Effect of Tilt Typical applications Demonstration

E N D
Accelerometers Justin Piccirillo Texas Instruments Incorporated Sensors & Controls Division jpiccirillo@ti.com
Summary • Definition of Acceleration • Technologies • Texas Instruments - Capacitive Acceleration Sensor (CAS) • Terminology • Effect of Tilt • Typical applications • Demonstration • Summary • Questions & Answers
Acceleration Fundamentals • What is Acceleration? • Definition: the time rate ofchange of velocity • A.K.A.: the time rate of changeof the time rate of change of distance • What are the units? • Acceleration is measured in (ft/s)/s or (m/s)/s • What is a “g”? • A “g” is a unit of acceleration equal to Earth’s gravity at sea level • 1 g = 32.2 ft/s2 or 9.81 m/s2
More Notes on Acceleration • What is the time rate of change of velocity? • When plotted on a graph, velocity is the slope of distance versus time • Acceleration is the slope of velocity versus time
What are some “g” reference points? Description “g” level Earth’s gravity 1g Passenger car in corner 2g Bumps in road 2g Indy car driver in corner 3g Bobsled rider in corner 5g Human unconsciousness 7g Space shuttle 10g Acceleration in Human Terms
What’s the point? • Why measure acceleration? • Acceleration is a physical characteristic of a system. • The measurement of acceleration is used as an input into some types of control systems. • The control systems use the measured acceleration to correct for changing dynamic conditions
Common Types of Accelerometers Sensor CategoryKey Technologies • Capacitive-Metal beam or micromachined feature produces capacitance; change in capacitance related to acceleration • Piezoelectric -Piezoelectric crystal mounted to mass – voltage output converted to acceleration • Piezoresistive-Beam or micromachined feature whose resistance changes with acceleration • Hall Effect-Motion converted to electrical signal by sensing of changing magnetic fields • Magnetoresistive-Material resistivity changes in presence of magnetic field • Heat Transfer-Location of heated mass tracked during acceleration by sensing temperature
CAS What Type of Acceleration Sensor Does TI Produce and why? • Capacitive Acceleration Sensor • “CAS”
CAS Conceptual Design AccelerationInduced Load 100 Movable Blade 75 Output Voltage Capacitive SensingElement OUTPUT (%Vcc) 50 25 Rigid Substrate BearingPin 0 ACCELERATION Electronic Calibration Acceleration Voltage Output Proportional to Mech. Input Change in Capacitance Conditioning Electronics Mechanical Deflection
Capacitive Sensing Element (CSE) Blade(welded to bearing pin) Capacitancedetect Capacitance generated by electrical current through parallel plates: Compliant Pins • C = capacitanceK = dielectric constant of the insulating mediumeo = permittivity of free spaceA = effective aread = distance between plates (gap) function of acceleration Substrate
Conditioner Module Connection to Base Application Specific Integrated Circuit (ASIC): Works in conjunction with discrete electronic components (i.e.: capacitors, resistors, thermistors, etc.) to transform the variable capacitance read at the CSE into an output voltage given an electrical potential (Vcc vs. GND = 5V) ASIC Connection to CSE
Capacitive Acceleration Sensor Conditioner Module Base Blade BearingPin Shell Bracket Substrate Cup CompliantPins ProtectiveSleeve
Acceleration Sensor Terminology (Typical TI Convention) +1g:Output of the sensor with the base connector pointed up 0g:Output of the sensor with the base connector horizontal -1g:Output of the sensor with the base connector pointed down Linearity:The maximum deviation of the calibration curve from a straight line.
Acceleration Sensor Terminology Sensitivity:A measure of how much the output of a sensor changes as the input acceleration changes. Measured in Volts/g Vcc:The voltage supplied to the input of the sensor • 5.000 ± 0.25V for CAS device %Vcc:Readings are often represented as a % of the supply voltage. This allows for correction due to supply voltage variances between readings.
Acceleration Sensor Terminology • Ratiometric: The output of the sensor changes with a change in the input voltage. • Example: At Vcc = 5.000V, Vout at 0g = 1.800V In terms of %Vcc, this is 1.800Vout/5.000Vcc *100% = 36%Vcc Now suppose the input voltage changes: Vcc = 5.010V. At 0g, the ratiometric device output is still 36% Vcc. In terms of the output voltage, 36%Vcc * 5.010Vcc = 1.804Vout • So a 0.010V change in Vcc will cause a 0.004V error in the 0g output if you do not evaluate the output as %Vcc
DC Response • DC response means that a sensor can measure 0Hz (static) events. • Static position or tilt are 0Hz events • Some sensor types cannot measure static events. They need motion to give an output. This type of sensor rolls off as you get closer to 0Hz. • The CAS is a DC response sensor
Effect of Tilt • DC response sensors measure tilt. Mounting errors are therefore significant • a 1o tilt in the 0g position creates an output error equivalent to a 10o tilt in the +1g or -1g positions • 0g is the most sensitive to mounting errors
Why is device sensitive to tilt in the 0g orientation? Gx q Gn=G*Cos(q) g level going from 1g to some % of 1g q Gx G G q Gn blade Gn pin Gn = G*Sin(q) g level going from 0g to some value CSE substrate q +1g Position (-1g Position uses same equation) q = 1° → Gn = 0.9998*G 0g Orientation q = 1°→ Gn = 1.7x10⁻²*G Conclusion: at 0g orientation, change in 1° tilt causes 57x bigger change in sensor output versus -1g or +1g orientation
CAS Output Voltage Change with Position Change in Output (mV) 500mV/g Device Degrees Effect of Tilt on DC Accelerometer
Typical Accelerometer Applications • Tilt / Roll • Vibration / “Rough-road” detection • Can be used to isolate vibration of mechanical system from outside sources • Vehicle skid detection • Often used with systems that deploy “smart” braking to regain control of vehicle • Impact detection • To determine the severity of impact, or to log when an impact has occurred • Input / feedback for active suspension control systems • Keeps vehicle level
Important Setup Requirements for your CAS Device • Rigid Mounting • Bees Wax • Double Sided tape • Bolt(s) • No Loose Wires • Loose wires can create false signals • Secure wires firmly to mounting body • Weight of Sensor • Should be approximately an order of magnitude less than object being measured • Example: CAS = 47g; accelerating object should be more than 470g • Don’t drop the sensor! • Extreme jarring accelerations can cause permanent errors in device output
Electronics Setup Piezoelectric speaker 9V 1 channel 12 bit A/D Converter “LTC1286” Serial connection to PC CAS Sensor Vcc Microprocessor, RAM, EEPROM
Summary • Acceleration is a measure of how fast the speed of something is changing • It is used as an input to control systems • Sensor voltage output should be determined as a percentage of voltage input for consistency • The device is sensitive to tilt in the 0g position • ΔVout for 1o tilt in 0g = ΔVout for 10o of tilt in the +1g and -1g positions • Application of the device must be done in a secure fashion and to bodies having an appropriate sensor-to-body weight ratio • Think about how you can best use the data • Sample rates (if sensor output is to be converted to digital) • Averaging schemes • Control limits
Frequency Response (FR) • Definition of FR • A sensors ability to track a given input acceleration in both magnitude and time • Why is FR important? • Tells us how well a sensor will measure acceleration over a wide range of frequencies. • Allows us to design sensors to measure only the quantities of interest: (i.e. want to measure a braking event but not vibrations in the mounting panel.)
Components of FR • Magnitude or Amplitude • Ratio of the output (CAS) / input (reference accel. output) • Calculated in Decibels (dB) = 20 * log10(CAS Output Voltage / reference acceleration output voltage) • Phase Angle • A measure of the time delay between the input and the output (CAS) • No time delay would have a Phase angle = 0 degrees • Frequency • A measure of the rate at which an event occurs • 1Hz = 1 cycle/second • The higher the frequency the faster the event occurs
Measurement of FR • Equipment • Shaker Table • Signal Analyzer • Reference Accelerometer • CAS • Setup • Both the reference accelerometer and the device being measured (CAS) are mounted to the shaker table. • The voltage outputs of both sensors are sent to the signal analyzer • The signal analyzer compares the reference’s output to the CAS output and produces several graphs.
Key Information on FR Graphs • Magnitude Graph • -3dB Point (Often referred to as the roll off point): This is the frequency (Hz) point where the measured output of the sensor is equal to 70% of the input acceleration. • The output is attenuated beyond the -3dB point in order to filter out unwanted inputs • Ex. Input = 10g but the output = 7g • Calculated 20*log(7/10) = -3dB • Typical -3dB points for a CAS • 10 to 60 Hz
Key Information on FR Graphs • Phase Graph • The phase angle must be less than a specified amount at a specified frequency. Each customer will specify different values. • Examples of phase specifications • 10o at 5Hz • 10o at 10 Hz • 70o at 15Hz
CAS Design Characteristics Effecting FR • Air Damping of the blade • The CAS metal beam is critically damped. • The higher the frequency of the event the more the air in the gap reduces the movement of the blade. • The 0g gap has set limits to make sure that the sensor remains critically damped. • If the gap is too small the sensor becomes over-damped and will give a reduced output. • If the gap is too large the sensor becomes under-damped and will give an amplified output.
CAS Design Characteristics Effecting FR • Effect of Gap on Frequency Response, -3dB
CAS Design Characteristics Effecting FR • Electrical Filters • Capacitors and resistors on the circuit electrically filter the output of the CAS • Different capacitor and resistor values in combination with the mechanical air damping of the blade create different -3dB points • One design needs -3dB < 15Hz • Another design needs -3dB ~ 50Hz