Download
1 / 28
280 likes | 390 Views
NARCCAP Fourth Users’ Meeting Welcome! Linda O. Mearns National Center for Atmospheric Research . Boulder, CO April 10 - 11, 2012. Meeting Goals . Learn about NARCCAP – conceptually and nuts and bolts

E N D
NARCCAP Fourth Users’ Meeting Welcome! Linda O. Mearns National Center for Atmospheric Research Boulder, CO April 10 - 11, 2012
Meeting Goals • Learn about NARCCAP – conceptually and nuts and bolts • Interact with modelers and other scientists on NARCCAP Team– get questions answered – give users’ perspectives • See what other users have been working on -- network with other users with similar research interests - develop projects • Discuss with NARCCAP Team further development ideas for data provision and information on web site for users • Have fun!
Uncertainties aboutFuture Climate • The future trajectory of emissions of greenhouse gases (based on uncertainties about how the world will develop economically, socially, politically, technologically) • Explored through the development of scenarios of future world development • How the climate system responds to increasing greenhouse gases. • Explored through use of climate models • Spatial scale at which climate models are run is part of this source of uncertainty • Internal natural variability of the climate system
The Future Warming will increase if GHG increase. If GHG were kept fixed at current levels, a committed 0.6°C of further warming would be expected by 2100. More warming would accompany more emission. CO2 Eq 3.4oC = 6.1oF 850 2.8oC = 5.0oF 600 1.8oC = 3.2oF 400 0.6oC = 1.0oF
Uncertainty on Regional Scales Fraction of total variance in decadal mean air temperature predictions explained by the three components of uncertainty Internal variability Orange = internal variability Green = emissions scenario uncertainty Blue = model uncertainty Hawkins and Sutton, 2009
What about higher resolution information about climate change? • Global models run at about 200 km spatial resolution - what resolution do we need for adaptation planning in various sectors (water resources, agriculture etc.) • How to balance the desire for higher resolution with the other major uncertainties (future emissions, general response of climate system, internal variability).
Global Climate Models Regional Climate Models
Advantages of higher resolution North America at typical global climate model resolution Hadley Centre AOGCM (HadCM3), 2.5˚ (lat) x 3.75˚ (lon), ~ 280 km North America at 50 km grid spacing
Regional climate models allow use of finer resolution • HadCM3 grid spacing is about 280 km. • To reduce the spacing to 50 km, we would need (280/50)3 = 175 times the computing power. • Proposal: Use a finer-scale model over only a limited region of interest.
Regional Modeling Strategy Nested regional modeling technique • Global model provides: • initial conditions – soil moisture, sea surface temperatures, sea ice • lateral meteorological conditions (temperature, pressure, humidity) every 6-8 hours. • Large scale response to forcing (100s kms) • Regional model provides finer scale (10s km) response
Examples Where Regional Modeling Is Useful • Complex topography (mountains) • Regions with small irregular land masses (e.g., the Caribbean) • Complex coastlines (e.g., Italy) • Heterogeneous landscapes
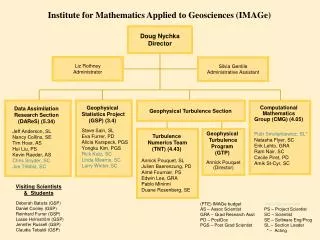
The North American Regional Climate Change Assessment Program (NARCCAP) www.narccap.ucar.edu • Explores multiple uncertainties in regional • and global climate model projections • 4 global climate models x 6 regional climate models • Develops multiple high resolution (50 km) • regional climate scenarios for use in impacts • and adaptation assessments • Evaluates regional model performance to establish • credibility of individual simulations for the future • Participants: Iowa State, PNNL, LLNL, UC Santa Cruz, Ouranos (Canada), UK Hadley Centre, Scripps, NCAR • Initiated in 2006, funded by NOAA-OGP, NSF, DOE, USEPA-ORD
NARCCAP - Team Linda O. Mearns, NCAR Ray Arritt, Iowa State, Dave Bader, LLNL, WilfranMoufouma-Okia, Hadley Centre, SébastienBiner, Daniel Caya, Ouranos, Phil Duffy, LLNL,Climate Central, Dave Flory, Iowa State, William Gutowski, Iowa State, Isaac Held, GFDL, Richard Jones,Simon Tucker, Hadley Centre, Bill Kuo, NCAR; René Laprise, UQAM, Ruby Leung, PNNL, Larry McDaniel, Seth McGinnis, Don Middleton, NCAR, Ana Nunes, U. Rio de Janeiro, Scripps, Doug Nychka, NCAR, John Roads*, Scripps, Steve Sain, NCAR, Lisa Sloan, Mark Snyder, UC Santa Cruz, Ron Stouffer, GFDL, Gene Takle, Iowa State * Deceased June 2008
Organization of Program • Phase I: 25-year simulations using NCEP-Reanalysis boundary conditions (1980—2004) • Phase II: Climate Change Simulations • Phase IIa: RCM runs (50 km res.) nested in AOGCMs current and future • Phase IIb: Time-slice experiments at 50 km res. (GFDL and NCAR CAM3). For comparison with RCM runs. • Quantification of uncertainty at regional scales – probabilistic approaches • Scenario formation and provision to impacts community led by NCAR. • Opportunity for double nesting (over specific regions) to include participation of other RCM groups (e.g., for NOAA OGP RISAs, CEC, New York Climate and Health Project, U. Nebraska).
Phase I 6 RCMs (RegCM3, WRF, CRCM*, ECPC RSM*, MM5, HadRM3): Reanalysis (NCEP)-driven runs Time period:1980-2004 for all selected RCMs Configuration: common North America domain (some differences due to horizontal coordinates) horizontal grid spacing 50 km boundary data from NCEP/DOE Reanalysis 2 boundaries, SST and sea ice updated every 6 hours * Spectral nudging applied Mearns et al., 2012 BAMS(in press)
NARCCAP PLAN – Phase II A2 Emissions Scenario GFDL CGCM3 HADCM3 CCSM3 CAM3 Time slice 50km GFDL Time slice 50 km Provide boundary conditions 2041-2070 future 1971-2000 current CRCM Quebec, Ouranos RegCM3 UC Santa Cruz HADRM3 Hadley Centre MM5 Iowa State RSM Scripps WRF PNNL
Quantification of Uncertainty • The four GCM simulations already ‘situated’ probabilistically based on earlier work (Tebaldi et al., 2004) • RCM results nested in particular GCM would be represented by a probabilisitc model (derived assuming probabilistic context of GCM simulation) • Use of performance metrics to differentially weight the various model results
The NARCCAP User Community • Three user groups: • Further dynamical or statistical downscaling • Regional analysis of NARCCAP results • Use results as scenarios for impacts studies • www.narccap.ucar.edu • Over 500 users • To sign up as user, go to web site – contact Seth McGinnis, • mcginnis@ucar.edu
Articles Using NARCCAP • Wang et al., 2009: Evaluation of precipitation in the intermountain region as simulated by the NARCCAP regional climate models,GRL 36: L11704, doi:10.1029/2009GL037930 • Leung, L. R. and Qian, Y.,2009: "Atmospheric Rivers Induced Heavy Precipitation and Flooding in the Western U. S. Simulated by the WRF Regional Model, GRL 36: 10.1029/2008GLO36445 • Mearns, L. O., et al., 2009: A regional climate change assessment program for North America, EOS 90: 311 • Gutowski, W. J., et al., 2010: Regional extreme monthly precipitation simulated by NARCCAP RCMs, J. of Hydrometeorology, 10.1175/2010JHM1297.1
Articles (cont’d) • Schliep, E.M., et al., 2010: A comparison study of extreme precipitation from six different regional climate models via spatial hierarchical modeling, Extremes13: 219-239, doi:10.1007/s10687-009-0098-2. • Christensen, W.F. and S. Sain, 2011: Spatial latent variable modeling for integrating output from multiple climate models, Mathematical Geosciences, doi: 10.1007/s11004- 011-9321-1. • Greasby, T.A. and S. Sain, 2011, Multivariate spatial analysis of climate change projections, J. of Agricultural, Biological, and Environmental Statistics, 16, 571- 585, doi: 10.1007/s13253-011-0072-8 • Sain, S.R., D. Nychka,and L. Mearns, 2011: Functional ANOVA and regional climate experiments: A statistical analysis of dynamic downscaling, Environmetrics, 22, 700- 711, doi: 10.1002/env.1068
Articles (cont’d) • Bukovsky, M. S., 2012: Temperature trends in the NARCCAP regional models, J. of Climate (in press) • Rangwala, I. et al., 2012: Mid-21st century projections in temperature extremes in the southern Colorado Rocky Mountains from regional climate models. Clim. Dyn. DOI 10.1007/s00382-011-1282-z • Salzmann, N. and L. O. Mearns, 2012: Assessing the performance of multiple regional climate model simulations for seasonal mountain snow in the upper Colorado River Basin, J. of Hydrometeorology (in press). • Sobolowski, S. and T. Pavelsky, 2012: Evaluation of present and future North American Regional Climate Change Assessment Program (NARCCAP) regional climate simulations over the southeast U.S.JGR 117: