Download
1 / 12
120 likes | 233 Views
Chi-square test on candidate events from CW signals coherent searches ( Y. Itoh, M.A.Papa,B.Krishnan-AEI, X. Siemens –UWM. A large value of the detection statistic indicates a candidate signal at the frequency and the sky position .

E N D
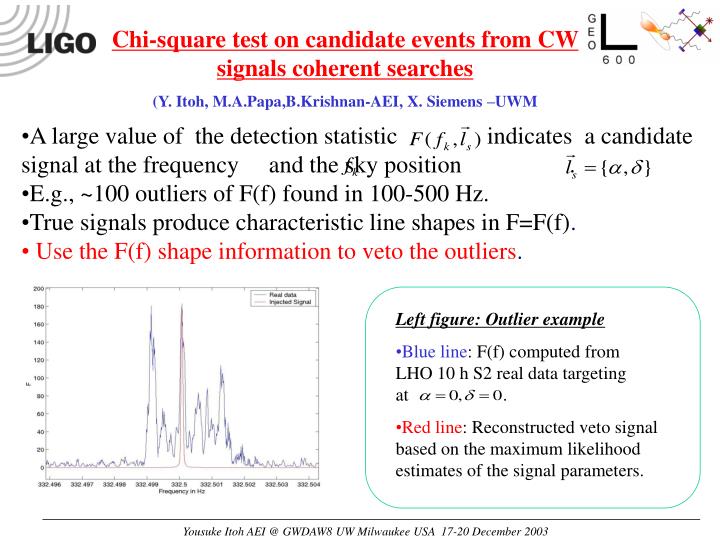
Chi-square test on candidate events from CW signals coherent searches (Y. Itoh, M.A.Papa,B.Krishnan-AEI, X. Siemens –UWM • A large value of the detection statistic indicates a candidate signal at the frequency and the sky position . • E.g., ~100 outliers of F(f) found in 100-500 Hz. • True signals produce characteristic line shapes in F=F(f). • Use the F(f) shape information to veto the outliers. • Left figure: Outlier example • Blue line: F(f) computed from LHO 10 h S2 real data targeting at . • Red line: Reconstructed veto signal based on the maximum likelihood estimates of the signal parameters. Yousuke Itoh AEI @ GWDAW8 UW Milwaukee USA 17-20 December 2003
Basic Idea(1) The detection statistic: Jaranowski et al. Phys.Rev.D58:063001,1998 • If the data=random Gaussian noise (r.g.n) • ( distribution) • If data=r.g.n + signal • • (Non-cent. with Non-cent. param.= SNR) • Hypothesis: data=rand. Gaussian noise + signal • • becomes the χ^2 dist. if our reconstruction of the signal is good! Yousuke Itoh AEI @ GWDAW8 UW Milwaukee USA 17-20 December 2003
Basic Idea (2) • Use the maximum likelihood estimates of the signal parameters. • instead of unknown • Use the targeting sky position • instead of unknown signal sky position • If the veto statistic is extremely large, we veto out the outlier. • Need to be careful • SNR dependent threshold on the veto statistic. • (Cf. TAMA inspiral upper limit report) Yousuke Itoh AEI @ GWDAW8 UW Milwaukee USA 17-20 December 2003
Safety test False dismissal • Procedure • Inject ~ 10^6 fake signals with randomly chosen signal params and signal sky positions into 10 h Gaussian stationary noise. • Compute (~SNR) and the veto statistic for each outlier. Targeting sky position satisfies The red line gives 0 % false dismissal for this experiment. Yousuke Itoh AEI @ GWDAW8 UW Milwaukee USA 17-20 December 2003
Efficiency test False alarm • Procedure • Inject ~ 10^6 damped line noises with randomly chosen params into 10 hGaussian stationary noise. • Compute (~SNR) and the veto statistic for each outlier. Targeting sky position satisfies The red line gives 8 % false alarm for this experiment. Yousuke Itoh AEI @ GWDAW8 UW Milwaukee USA 17-20 December 2003
Application to Real data • Procedure • Apply the veto method on 10 hLHO4K S2 real data starting from GPS time 731210229. • Compute (~SNR) and the veto statistic for each outlier. • 1200 targeting sky positions are randomly chosen. • Frequency band is 100-500 Hz. 465.7 Hz line 16 Hz multiples The red line vetos 69 % of the outliers found in this data. Some of the “Arms” are due to lines with particular freqs. Yousuke Itoh AEI @ GWDAW8 UW Milwaukee USA 17-20 December 2003
Application to Real data With the line noise table provided by R. Berkowitz, M. Landry, D. Ottaway, R. Schofield Preliminary! • Procedure (yet to be examined!) • Remove 16 Hz multiples (+-1Hz). • Remove the measured lines between 344-350 Hz. 465.7 Hz line 16 Hz multiples Experimentalists veto out some of the arms most efficiently! The red line now vetos 75 % of the outliers found in this data. Yousuke Itoh AEI @ GWDAW8 UW Milwaukee USA 17-20 December 2003
Remarks and Conclusion • Our veto method is rather efficient: Even with rough parameters tuning, it is demonstrated for some real data that adopting some threshold on our veto statistic, ~ 69 % of the outliers can be vetoed out. Safety test shows that the same threshold on the veto statistic gives effectively 0% (modulo sample variance) false dismissal rate. • We have performed the safety and efficiency tests on the real data and obtained similar results. • There are still outliers that we might keep. While studying parameters tuning and making the method more efficient, we study other veto methods and use combinations of various veto methods. Yousuke Itoh AEI @ GWDAW8 UW Milwaukee USA 17-20 December 2003
Veto the outliers in FDS Other possible veto strategies not yet studied. (a) Coincidence among other channels: F stat. outliers characteristic line noises of the instruments. Coincidence analysis among h(t) and other channels. Needs Veto channels selection. (b) Follow up: If true signal, the amplitude of F stat. varies w.r.t. time in a predictable maner (= Doppler amp./phase mod. etc.). Search the signal in the other IFOs, time periods, etc. (c) Coincidence among the IFOs. Consistency check on the MLEs of the strain that the IFOs give us. Yousuke Itoh AEI @ GWDAW8 UW Milwaukee USA 17-20 December 2003
465.7 Hz line Tuning the Veto method • Left figure: 465.7 Hz line in F(f) • Blue line: F(f) computed from LHO 10 h S2 real data targeting at . • Red line: Reconstructed veto signal based on the maximum likelihood estimates of the signal parameters. Method and parameter tuning are being studied. Yousuke Itoh AEI @ GWDAW8 UW Milwaukee USA 17-20 December 2003
Histogram Convergence of the probability at given SNR Normalized histogram as a function of the veto statistic for some selected ranges of SNR. Efficiency test Safety test Pdf is well estimated. Sample size in each class is ~ 10^4-5. Yousuke Itoh AEI @ GWDAW8 UW Milwaukee USA 17-20 December 2003
Signal Parameters Maximum Likelihood Estimates of the Signal Parameters. • Left figure: Goodness of the estimates • Goodness of the Maximum likelihood estimates of the four amplitudes. • Injected signals are the same as those in the safety test. Thus, ~10^6 fake signals injected into 10 h stationary Gaussian random noise. Signal parameters are well estimated. Yousuke Itoh AEI @ GWDAW8 UW Milwaukee USA 17-20 December 2003


