Download
1 / 52
520 likes | 741 Views
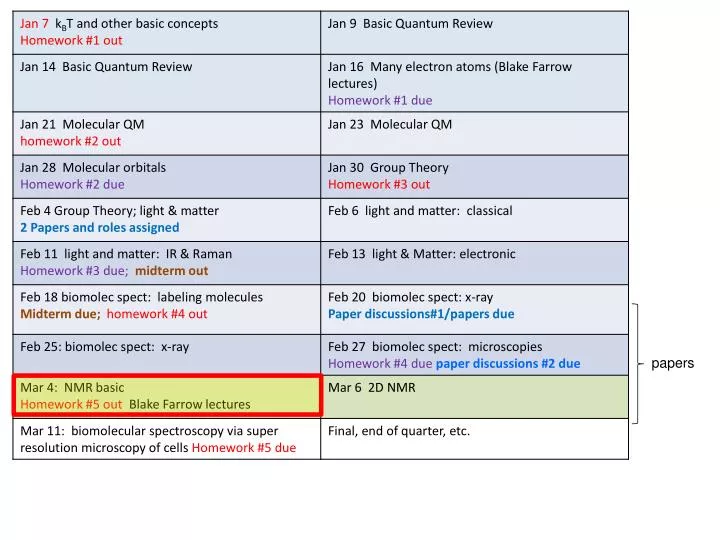
papers. Biophysical Magnetic Resonance. Theory and Applications. Major points to learn today What is NMR? – basic physics, transition dipole why are NMR signals weak? Relaxation times (t1 and t2)

E N D
Biophysical Magnetic Resonance Theory and Applications
Major points to learn today What is NMR? – basic physics, transition dipole why are NMR signals weak? Relaxation times (t1 and t2) NMR spectroscopy of simple molecules (Pascal’s triangle, chemical shifts)
NMR- Why is it useful? • Unparalleled chemical specificity. • Quantitatively interpretable at molecular level. • Structures without crystals. • Diverse dynamic probes from 10-12 to 102 s. • Nondestructive. • Penetrates nearly all samples.
Spin and Intrinsic Magnetism • Fundamental particles have intrinsic angular momentum which is proportional to a magnetic moment. • Spin angular momentum and the magnetic moment are proportionally related by the gyromagnetic ratio, which can be positive or negative. μ = magnetic moment (North/South vector) S = spin angular momentum, an intrinsic quantity of the particle γ = gyromagnetic ratio, also intrinsic quantityassociated with the particle
NMR Active Nuclei • There are a number of biologically relevant nuclei with spin • The most sensitive is 1H • Sensitivity is determined both by γ and natural abundance There’s a lot of it, and it’s got abig γ, meaning it makes a big μ.
Spin States are Quantized • Spin is a quantum mechanical phenomenon, so it is quantized. • For a given spin quantum number S, the spin state mS can only take values S, S-1, S-2, …, -S. • The number of states available for a given spin is given by 2S+1. • We generally only deal with spin ½ particles, since other’s have quadrupole angular momenta, instead of dipole (complicated and unimportant to you guys). So, for a spin ½ particle, there are two spin states: mS= +½, -½. Or and .
Spin in a Magnetic Field • At zero field, the spin states mS = S, S-1, …, -S all have the same energy. (I.e., they are degenerate.) • When spins experience an applied magnetic field, the spin states separate. For H1nuclei at 1 Tesla, this ΔE is about 10-7eV. Very lowenergy. This means that at room temperature the nuclei tend to be in both and states more or less equally. This makes the signal very weak.
Vector Interpretation • This can also be visualized as spin “vectors” partially aligning with the magnetic field. • A spinning top might process around its axis of spinning. • A bunch of these tops will process at different angles at a given time (spinning out of phase), but will add up to one net direction (M0)
Spin Precession • Physically, this is the external field producing a “torque” on nuclei (similarly to that of gravity on a top) that causes them to precess around the field. • The direction of spin follows the right hand rule, and the frequency of spin is known as the Larmor frequency. Larmor frequency
NMR Spectroscopy • Like any other spectroscopy, we need to detect the absorption/emission of radiation to obtain a signal which only happens when the emitted radiation matches the energy gap. • Originally this was done by irradiating the sample with a fixed radiowave frequency, then sweeping the applied field until resonance was observed (continuous wave NMR). • Nowadays a constant magnetic field is applied, and a spectrum of radiowave frequencies are applied all at once.
NMR Signal • NMR doesn’t directly look at longitudinal magnetization, rather it measures magnetization perpendicular to the field. • A radiofrequency pulse along the x-direction rotates the net magnetization vector into the x-y plane. • As discussed previously, once off-resonance the net magnetization precesses around the applied field at the Larmor frequency. B0
Signal Detection • Signal precession is detected by the receiver coil, which is often the same coil used to pulse the sample. • The oscillating magnetic field induces a current in the receiver coil, which is recorded as a function of time and is called the Free Induction Decay (FID).
Relaxation • There are two main modes of relaxation in NMR, T1 and T2 • Magnetization re-establishes an equilibrium value along the z-axis according to T1 • Free Induction Decay is called so because its amplitude decreases with time according to T2 • For small molecules freely rotating in solution T1 T2 • For larger molecules or viscous solutions T1 >>> T2
T1 • T1 is called the longitudinal relaxation time, and is the time required for the net magnetic vector to return to the z-axis after being tipped into the x-y plane. • This is what dictates how long one must wait between scans, thus determining the practical limit of S/N improvement by obtaining multiple FIDs.
T1 Mechanisms • Another name for T1 is the spin-lattice relaxation time • Intermolecular mechanisms • Unpaired electrons • Extramolecular nuclei • Intramolecular mechanisms • Dipole-dipole • Chemical shift anisotropy • Spin rotation • Scalar coupling • Quadrupolar relaxation • Solution state T1’s for 1H is usually sub second, for 13C on the order of seconds, and for 15N on the order of a minute.
T2 • T2 is the transverse relaxation time, and is the time it takes for the tipped net magnetization vector to decohere. • T2 is the amount of time during which there is measurable coherence, so it determines the sampling time, or acquisition time, of an experiment
T2 Mechanisms • T2 differs from T2*, which is a combination of inherent T2 and magnetic field inhomogeneity • Inherent T2 is caused by the loss of phase coherence that results from each resonance possessing a slightly different Larmor frequency. • Considerations: • Viscosity • Spin exchange • T2 can never be longer than T1, but if the molecular motions are slow it can be much shorter
Signal to Noise • The signal from a thermally polarized NMR experiment is weak. • S/N can be improved by taking multiple transients. S/N proportional to (# transients)1/2
Extracting Meaning from NMR Signal • The time dependent FID contains a wealth of information about the chemical environment experienced by the detected spins. • However, it’s difficult to visually interpret. • So, we transform the data into a frequency spectrum and use tricks to help extract observable quantities like chemical shift and spin coupling. • These observables give us information about the molecular structure and dynamics of a sample.
Fourier Transform • The Fourier transform is used to change a time dependent NMR signal to a frequency dependent spectrum. • Continuous Fourier transform • Discrete Fourier transform:
Discrete FT • Sampling rate: distance between time steps • Nyquist frequency: highest frequency that can be defined by a particular sampling rate So, if a FID is sampled every 0.01 sec, the frequency range that can be detected is -50 -> 50 Hz.
FID Manipulation Tricks • Zero filling • Adds zero points to the end of the FID. • Increases resolution without adding extra acquisition time or noise. • Truncation and apodization • Increases S/N by emphasizing the initial points of the FID • Truncation can create baseline distortion due to abrupt change in signal amplitude • Apodization adds non-zero points to more gradually decrease the FID
Tricks Continued • Exponential multiplication • The FID is multiplied by an exponential of the form exp(At–Bt2) • An increasing exponential will improve resolution • A decreasing exponential will improve S/N These cannot be achieved simultaneously! • The most common use of this technique is when B=0 and A < 0. (line broadening) • If both A, B > 0 a Lorentz to Gauss transformation is achieved
Chemical Shift • Caused by local magnetic field distortions from nearby electrons, which change the Larmor frequency for nuclei in different chemical environments. • Both the Larmor frequency and the chemical shift are field dependent, so the adjusted chemical frequencies are reported in field-independent ppm units relative to some standard. • ppm on a 700 MHz/16.4 T NMR would be 700 Hz, but on a 50 MHz/1.1 T NMR would be 50 Hz. So given the same sensingmechanism, bigger field is way better.
Chemical Shift • Nuclei are said to be “shielded” if surrounded by a high density of electrons, and are progressively “deshielded” as the electrons around the nucleus decrease. Deshielded Shielded
Spin-spin coupling • Also known as j-coupling. • Measured in Hz. • Indirect “communication” between neighboring spins via surrounding electrons allows spins to “feel” the spin state of their neighbor. • For neighboring spin ½ nuclei, the rule is that there are n + 1 peak splittings for n neighboring nuclei, with amplitudes given by the nth row of Pascal’s triangle.
Dipolar Coupling • Direct coupling between spin “dipoles”. • Rapid tumbling in solution averages the dipolar coupling to zero. • In viscous solutions or with large molecules, partial alignment leads to incomplete averaging of the dipolar coupling. • Residual Dipolar coupling • Useful in structural biology to determine long range distance constraints and in protein dynamics for long scale motions
Decoupling • Splitting increases the complexity of a spectrum • Can negate its effects with decoupling • Generally accomplished with selective irradiation of splitting nucleus • Constant irradiation induces rapid spin flips, which averages the effect of the neighboring spin states • A side consequence of 1H decoupling in 13C spectra is signal enhancement by the Nuclear Overhauser Effect
1D Experiments • Simple one pulse experiments are sometimes sufficient for determining small structures • Current Varian software has standard parameters built into the software that cover most general experiments. • Generally 1H spectra, sometimes in combination with 13C spectra, are taken and peak integrations along with chemical shifts and j-coupling information are used to assign peaks.
Proton Chemical Shifts downfield TMS=0 • Electronegative groups are "deshielding" and tend to move NMR signals from neighboring protons further "downfield" • Protons on O or N have highly variable chemical shifts sensitive to environment, esp. hydrogen bonding. • The p-system of alkenes, aromatic compounds and carbonyls deshield attached protons.
TMS H H H Chemical shift (ppm) 0 NMR peak positions vary with magnetic field recalln = gB0 / 2p HO-CH2-CH3 Low B field TMS High B field (better separation of peaks) H H H Chemical shift (ppm) 0
Equivalent H-atoms are degenerate However, the energy levels may be split by adjacent H-atoms (this is where much of the chemical information comes from) H is influenced by H H is influenced by H and H H is influenced by H HO-CH2-CH3 These peaks will split TMS H H H Chemical shift (ppm) 0
Splittings are described by Pascal’s triangle • 1 • 1 • 1 2 1 • 3 3 1 Coupled to 1 H Coupled to 2 H Coupled to 3 H
Coupling is significant Splitting is detected HO-CH2-CH3 Coupling is only to protons attached to adjacent nuclei Coupling is weak Splitting is not detected except at very high field (we’ll ignore) • 1 • 1 • 1 2 1 • 3 3 1 Coupled to 1 H H Coupled to 2 H H Coupled to 3 H
Coupling is significant HO-CH2-CH3 Coupling is weak because this H-O proton exchanges with local environment • 1 • 1 • 1 2 1 • 3 3 1 Coupled to 1 H H Coupled to 2 H H Coupled to 3 H TMS 1 2 3 H H H Chemical shift (ppm) 0
increasing B experienced by nucleus; increasing at fixed B. 1H NMR Spectrum of Ethanol Area = 3 HO-CH2-CH3 TMS Area = 1 Area = 2 Chemical shift (PPM)
downfield deshielding greater Beff upfield shielding smaller Beff increasing B experienced by nucleus; increasing at fixed B. NMR Spectrum of Ethanol HO-CH2-CH3 TMS Chemical shift (PPM)
why isn’t the OH proton also a triplet? when traces of water are present, the OH proton exchanges with water CH3CH2OH + H2O CH3CH2O- + H3O+ This proton exchange disrupts the spin-spin coupling between the OH and CH2 protons, so only a single OH proton is observed. At low temperatures and with pure ethanol, the OH signal is a triplet and the CH2 signal is a(n) ???
Interpretation of NMR Spectra • Nuclei in different chemical environments resonate at different frequencies (chemical shift). Chemical shift charts can be used to assign peaks to groups on the basis of their resonance frequencies. • Signal intensities (from integrated peak areas) are usually directly proportional to the number of protons in each distinct chemical environment. • Interaction of nearby nuclei produce a splitting pattern (spin-spin coupling) that can be correlated with the structure of the molecule.
Chemical shifts The magnetic field, B, experienced at the nucleus of an atom, is not identical to the applied field, B0, due to shielding effects of the surrounding electrons: B = B0 (1 - s) or nNMR = g B0 (1 - s) / 2p where s is a (dimensionless) shielding constant. The electronic environment of the nucleus depends on chemical bonding, hence nNMR is sensitive to the detailed molecular structure
CH3-CH2-CH3 What do we expect to see? Two types of protons 6:2 intensity ratio • 1 • 1 • 1 2 1 • 3 3 1 • 1 4 6 4 1 • 5 10 10 5 1 • 1 6 15 20 15 6 1 H Coupled to 2 H H Coupled to 6 H
CH3-CH2-CH3 H H
o o How about this molecule? First, identify all of the protons
o o H H H H H H H H H H H H H H Now, identify which protons are unique
o o H H H H H H H H H H H H H H (2) e d (2) (2) f c (2) b (2) e (1) g a (3) f Next, identify splittings using Pascal’s triangle These protons are not going to be split their chemical shift is dominated by the ring current
Split by 0 protons unsplit Split by 2 protons Split by 5 protons Split by 2 protons Next, what are relative integrated peak intensities?
Split by 0 protons unsplit Split by 2 protons Split by 5 protons Split by 2 protons ∫Intensity= 52223 Next, what are relative chemical shifts of these peaks?
d a,b e-f c