Download
1 / 53
530 likes | 623 Views
Clustering microarray data. 09/26/07. Sub-classes of lung cancer types have signature genes. (Bhattacharjee 2001). Promoter analysis of commonly regulated genes. David J. Lockhart & Elizabeth A. Winzeler, NATURE | VOL 405 | 15 JUNE 2000, p827. Discovery of new cancer subtype.

E N D
Clustering microarray data 09/26/07
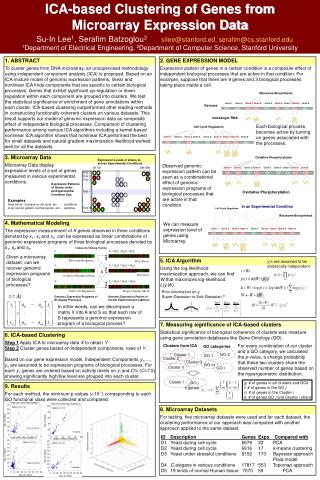
Sub-classes of lung cancer types have signature genes (Bhattacharjee 2001)
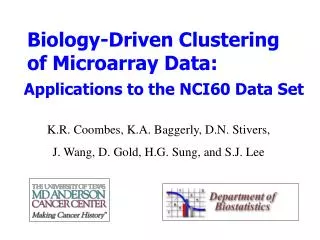
Promoter analysis of commonly regulated genes David J. Lockhart & Elizabeth A. Winzeler, NATURE | VOL 405 | 15 JUNE 2000, p827
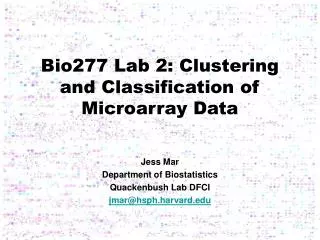
Discovery of new cancer subtype These classes are unknown at the time of study.
Overview • Clustering is an unsupervised learning clustering is used to build groups of genes with related expression patterns. • The classes are not known in advance. • Aim is to discover new patterns from microarray data. • In contrast, supervised learning refers to the learning process where classes are known. The aim is to define classification rules to separate the classes. Supervised learning will be discussed in the next lecture.
Dissimilar function To identify clusters, we first need to define what “close” means. There are many choices of distances • Euclidian distance: • 1 – Pearson correlation: • Manhattan distance: • …
Where is the “truth”? “ In the context of unsupervised learning, there is no such direct measure of success. It is difficult to ascertain the validity of inference drawn from the output of most unsupervised learning algorithms. One must often resort to heuristic arguments not only for motivating the algorithm, but also for judgments as to the quality of results. This uncomfortable situation has led to heavy proliferation of proposed methods, since effectiveness is a matter of opinion and cannot be verified directly.” Hastie et al. 2001; ESL
Clustering Methods • Partitioning methods • Seek to optimally divide objects into a fixed number of clusters. • Hierarchical methods • Produce a nested sequence of clusters (Speed, Chapter 4)
Methods • k-means • Hierarchical clustering • Self-organizing maps (SOM)
k-means • Divide objects into k clusters. • Goal is to minimize total intra-cluster variance • Global minimum is difficult to obtain.
Algorithm for k-means clustering • Step 1: Initialization: randomly select k centroids. • Step 2: For each object, find its closest centroid, assign the object to the corresponding cluster. • Step 3: For each cluster, update its centroid to the mean position of all objects in that cluster. • Repeat Steps 2 and 3 until convergence.
Shows the initial randomized centers and a number of points.
Centers have been associated with the points and have been moved to the respective centroids.
Now, the association is shown in more detail, once the centroids have been moved.
Again, the centers are moved to the centroids of the corresponding associated points.
Properties of k-means • Achieves local minimum of • Very fast.
Practical issues with k-means • k must be known in advance • Results are dependent on initial assignment of centroids.
How to choose k? Milligan & Cooper(1985) compared 30 published rules. 1. Calinski & Harabasz (1974) 2. Hartigan (1975) , Stop when H(k)<10 . W(k)= total sum of squares within clusters B(k)= sum of squares between cluster means
How to choose k (continued)? Random (Tibshriani 2001) Estimate log Wk for randomly data (uniformly distributed in a rectangle) Choose k so that Gap is largest. Observed log WK Gap k
How to select initial centroids • Repeat the procedure many times with randomly chosen initial centroids. • Alternatively, initialize centroids “smartly”, e.g. by hierarchical clustering
K-means requires good initial values. Hierarchical Clustering could be used but sometimes performs poorly. with-in sum of Sq. X:965.32 O:305.09
Hierarchical clustering Hierarchical clustering builds a hierarchy of clusters, represented by a tree (called a dendrogram). Close clusters are joined together. Height of a branch represents the dissimilarity between the two clusters joined by it.
How to construct a dendrogram • Bottom-up approach • Initialization: each cluster contains a single object • Iteration: merge the “closest” clusters. • Stop: when all objects are included in a single cluster • Top-down approach • Starting from a single cluster containing all objects, iteratively partition into smaller clusters. • Truncate dendrogram at a similarity threshold level, e.g., correlation > 0.6; or requiring a cluster containing at least a minimum number of objects.
Hierarchical Clustering 2 5 3 4 1 6 Dendrogram 5 4 3 2 6 1
2 2 2 5 5 5 3 4 3 4 4 3 1 1 1 6 6 6 Dendrogram can be reordered
Ordered dendrograms • 2 n-1 linear orderings of n elements • (n= # genes or conditions) • Maximizing adjacent similarity is impractical. So order by: • Average expression level, • Time of max induction, or • Chromosome positioning Eisen98
Properties of Hierarchical Clustering • Top-down approach is more favorable when only a few clusters are desired. • Single linkage tends to produce long chains of clusters. • Complete linkage tends to produce compact clusters.
Partitioning clustering vs hierarchical clustering 2 5 3 4 1 6 Dendrogram 5 4 3 2 6 1 k = 4
2 5 3 4 1 6 Dendrogram Partitioning clustering vs hierarchical clustering 5 4 3 2 6 1 k = 3
2 5 3 4 1 6 Dendrogram Partitioning clustering vs hierarchical clustering 5 4 3 2 6 1 k = 2
Self-organizing Map • Impose partial structure on the clusters (in contrast to the rigid structure of hierarchical clustering, the strong prior hypotheses used in Bayesian clus-tering, and the nonstructure of k-means clustering) • easy visualization and interpretation.
SOM Algorithm • Initialize prototypes mj on a lattice of p X q nodes. Each prototype is a weight vector whose dimension is the same as input data. • Iteration: for each observation xi, find the closest prototype mj, and for all neighbors of mk of mj, move by • During iterations, reduce learning rate a and neighborhood size r gradually. • May take many iterations before convergence.
With only a few nodes, one tends not to see distinct patterns and there is large within-cluster scatter. As nodes are added, distinctive and tight clusters emerge. • SOM is an “incremental learning” algorithm involving cases by case presentation rather than batch presentation. • As with all exploratory data analysis tools, the use of SOMs involves inspection of the data to extract insights.
Other Clustering Methods • Gene Shaving • MDS • Affinity Propagation • Spectral Clustering • Two-way clustering • …
“Algorithms for unsupervised classification or cluster analysis abound. Unfortunately however, algorithm development seems to be a preferred activity to algorithm evaluation among methodologists. …… No consensus or clear guidelines exist to guide these decisions. Cluster analysis always produces clustering, but whether a pattern observed in the sample data characterizes a pattern present in the population remains an open question. Resampling-based methods can address this last point, but results indicate that most clusterings in microarray data sets are unlikely to reflect reproducible patterns or patterns in the overall population.” -Allison et al. (2006)
Stability of a cluster Motivation: Real clusters should be reproducible under perturbation: adding noise, omission of data, etc. Procedure: • Perturb observed data by adding noise. • Apply clustering procedure to cluster the perturbed data. • Repeat the above procedures, generate a sample of clusters. • Global test • Cluster-specific tests: R-index, D-index. (McShane et al. 2002)
5 4 3 2 6 1 5 4 3 2 6 1
Global test • Null hypothesis: Data come from a multivariate Gaussian distribution. Procedure: • Consider a subspace spanned by top principle components. • Estimate distribution of “nearest neighbor” distances • Compare observed with simulated data.
R-index • If cluster i contains ni objects, then it contains mi = ni*(ni – 1)/2 of pairs. • Let ci be the number of pairs that fall in the same cluster for the re-clustered perturbed data. • ri = ci/mi measures the robustness of the cluster i. • R-index = Si ci / Si mi measures overall stability of a clustering algorithm.
D-index • For each cluster, determine the closest cluster for the perturbed data • Calculated the average discrepancy between the clusters for the original and perturbed data: omission vs addition. • D-index is a summation of all cluster-specific discrepancy.
Applications • 16 prostate cancer; 9 benign tumor • 6500 genes • Use hierarchical clustering to obtain 2,3, and 4 clusters. • Questions: are these clusters reliable?