Download
1 / 12
130 likes | 274 Views
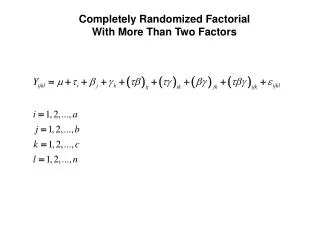
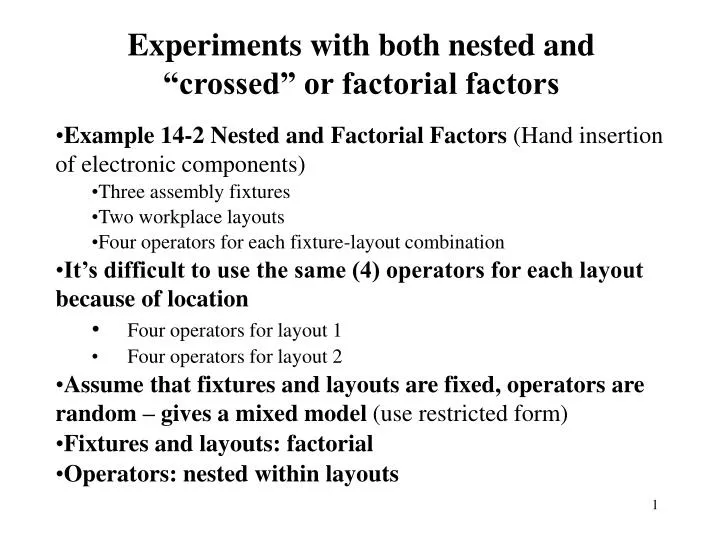
Experiments with both nested and “crossed” or factorial factors. Example 14-2 Nested and Factorial Factors (Hand insertion of electronic components) Three assembly fixtures Two workplace layouts Four operators for each fixture-layout combination

E N D
Experiments with both nested and “crossed” or factorial factors • Example 14-2 Nested and Factorial Factors (Hand insertion of electronic components) • Three assembly fixtures • Two workplace layouts • Four operators for each fixture-layout combination • It’s difficult to use the same (4) operators for each layout because of location • Four operators for layout 1 • Four operators for layout 2 • Assume that fixtures and layouts are fixed, operators are random – gives a mixed model (use restricted form) • Fixtures and layouts: factorial • Operators: nested within layouts
Example 14-2 – Minitab Analysis Table 14-12 Minitab Balanced ANOVA Analysis of Example 14-2 Using the Restricted Model
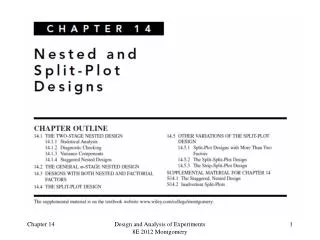
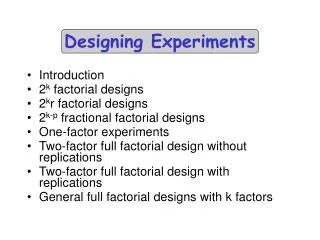
The Split-Plot Design • Text reference, Section 14-4 page 540 • The split-plot is a multifactor experiment where it is not possible to completely randomize the order of the runs • Example – paper manufacturing • Three pulp preparation methods • Four different temperatures • Each replicate requires 12 runs • The experimenters want to use three replicates • How many batches of pulp are required?
The Split-Plot Design • Pulp preparation methods is a hard-to-change factor • Consider an alternate experimental design: • In replicate 1, select a pulp preparation method, prepare a batch • Divide the batch into four sections or samples, and assign one of the temperature levels to each • Repeat for each pulp preparation method • Conduct replicates 2 and 3 similarly
The Split-Plot Design • Each replicate (sometimes called blocks) has been divided into three parts, called the whole plots • Pulp preparation methods is the whole plot treatment • Each whole plot has been divided into four subplots or split-plots • Temperature is the subplot treatment • Generally, the hard-to-change factor is assigned to the whole plots • This design requires only 9 batches of pulp (assuming three replicates)
The Split-Plot DesignModel and Statistical Analysis Table 14-15 Expected Mean Square Derivation for Split-Plot Design
Split-Plot ANOVA Table 14-16 Analysis of Variance for the Split-Plot Design Using Tensile Strength Data from Table 14-14 Calculations follow a three-factor ANOVA with one replicate Note the two different errorstructures; whole plot and subplot
The Agriculture Heritage of Split-Plot Design • Whole plots: large areas of land • Subplots: smaller areas of land within large areas • Example: Effects of variety, field, and fertilizer on the growth of a crop • One variety is planted in a field (a whole plot) • Each field is divided into subplots with each subplot is treated with one type of fertilizer • Crop varieties: main treatments • Fertilizers: subtreatments