Download
1 / 37
370 likes | 481 Views
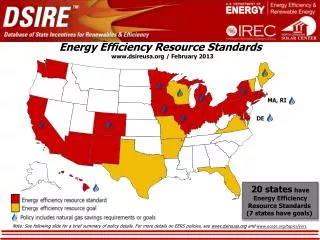
Pushing the Energy Efficiency Envelope through Appliance Standards Around the World. Christine Egan Executive Director, CLASP. Over 75 countries with more than 80 percent of the world's population have energy standards & labeling. Market Transformation.

E N D
Pushing the Energy Efficiency Envelope through Appliance Standards Around the World Christine Egan Executive Director, CLASP
Over 75 countries with more than 80 percent of the world's population have energy standards & labeling
Market Transformation Standards and labels work together to push and pull the market toward greater energy efficiency. Source: CLASP, Feb 2005, Energy-Efficiency Labels and Standards: A Guidebook for Appliances, Equipment, and Lighting.
Standards and Labeling Programs Impact the Environment On aggregate, reduces overall energy consumption • Reducing the energy consumption of a product Which, reduces power demand Which, reduces the need for the production of electricity Therefore, reducing green house gas emissions and other pollutants And, increasing the feasibility of renewable
Reasons for Implementing Standards and Labeling Programs • Reduce capital investment in the energy supply infrastructure • Less expensive than energy production • Makes renewable energy more affordable by reducing the need for energy production • Avert urban/regional pollution • Promote competitiveness of domestic manufacturers by avoiding non-tariff trade barriers • Secure energy independence • Meet climate change goals • Countries adopt standards and labeling policies for a number of reasons Source: CLASP, Feb 2005, Energy-Efficiency Labels and Standards: A Guidebook for Appliances, Equipment, and Lighting.
Buildings Technology Efficiency is Most Cost Effective Source: American Physical Society, September, 2008 http://www.aps.org/energyefficiencyreport/report/aps-energyreport.pdf
Energy Efficiency Standards Energy efficiency standards “PUSH” the market towards greater energy efficiency by removing inefficient products from the market. • Prescriptive Standards require that a particular feature or device be installed in all new products. • Minimum Energy Performance Standards (MEPS) require that a manufacturer achieve in each and every product a minimum efficiency (or maximum energy consumption); but does not require a specific technology or design. • Class-average Standards specifies the average efficiency of a manufactured product, allowing each manufacturer to select the level of efficiency for each model so that the overall average is achieved.
Energy Efficiency Standards(Minimum Energy Performance Standards) • The government sets a limit on the total amount of energy a product can use annually ≤ 400 kWh/a • The manufacturer designs the product to use less energy then the limit • The manufacturer tests the product using a designated test procedure to certify it uses less energy than the limit • The manufacturer then submits these results to the government or self-certifies them • The product can be sold on the market Source: CONUEE
Energy Efficiency Standards Shift Markets Clothes Washer Energy Factors in the U.S. before and after the 1994 standard 1994 Standard Source: CLASP
Comparative Label Comparative energy efficiency labeling “PULLS” the market towards greater energy efficiency by allowing consumers to compare the energy efficiency of products while making a purchasing decision, thus motivating manufactures to build products that that are more efficient then their competitors. Categorical Label (Dial) Continuous Label Categorical Label (Bars)
Comparative Labels (Categorical) • The government sets discreet categories based on specific ranges of energy use allowing comparison between products • The manufacture builds the product and test its energy use using a designated testing procedure in order to determine the proper category • The manufacture submits the results to the government or self certifies • The manufacturer labels their product with the correct category
Endorsement Label Endorsement energy efficiency labeling “PULLS” the market toward greater energy efficiency by identifying for consumers the most energy efficient products, thus providing an incentive (market advantage) for manufacturers to build highly efficient product. Korea United States European Union
Endorsement Labels • The government sets a minimum energy use threshold for entry into a program which recognizes highly energy efficient products • ≤ 100 kWh/a • The manufacturer designs the product to use less energy than the threshold so the product can receive this recognition • The manufacturer tests the product using a designated test procedure to certify it uses less energy than the threshold • The manufacturer then submits these results to the government that reviews and approves it • Once it has been approved, the product’s packaging can be labeled with the endorsement label, the manufacture can advertise the product’s endorsement, and usually the product will be listed on a government website
Minimum Efficiency Performance Standards (MEPS) • Advantages of MEPS • Provides predictable effects of eliminating low-efficiency products • Easy to ratchet levels periodically • Can be designed to maximize consumer benefits • Very low per unit transaction costs • Technology costs borne by consumer who also receives savings benefit • Disadvantages of MEPS • Usually a mandatory program – requires consensus/cooperation among multiple stakeholders • Can incur some up-front costs for consumers • Requires good enforcement policy • Savings Potential • Determined by available technology and cost-effectiveness • Major Stakeholders • Manufacturers, environmental groups, consumer groups
Comparative Labels • Advantages of Comparative Labels • Efficiency less compulsory - gives manufacturers the option of a wide range of efficiencies • Provides strong market incentive for efficiency • Market evolves over time at accelerated pace • Low per unit transaction costs • Technology costs borne by consumer who also receives savings benefit • Disadvantages of Comparative Labels • Impact of program less predictable • May be difficult to change labeling scheme • May or may not maximize consumer benefits • Savings Potential • Determined by market demand for higher efficiency products • Major Stakeholders • Manufacturers, environmental groups, consumer groups
Endorsement Labels • Advantages of Endorsement Labels • Usually voluntary - manufacturers can opt in or out • Provides market association between efficiency and quality • Can have large impact if endorsement level becomes de facto standard • Low per unit transaction costs • Technology costs borne by consumer who also receives savings benefit • Disadvantages of Comparative Labels • Impact of program difficult to predict • May or may not maximize consumer benefits • Savings Potential • Determined by market demand for highest efficiency products • Major Stakeholders • Manufacturers, environmental groups, consumer groups
Test Procedure • Test procedures should: • Reflect typical usage • Yield repeatable and accurate results • Be relatively inexpensive to perform • Test procedures can be developed either in country or adopted from an international body. • Testing should be conducted in an accredited laboratory to ensure that tests are being conducted properly. • Test procedures are the foundation of any standards and labeling program as they are used to determine the energy use of a product. Chinese Air Conditioner Testing Facility
Manufacturing Cost vs. Energy Savings Product energy efficiency is the result of a series of incremental modifications to features, technology, and design.The goal of standards and labeling setting is to strike a balance between increased costs of manufacturing and energy savings. Source: CLASP, Feb 2005, Energy-Efficiency Labels and Standards: A Guidebook for Appliances, Equipment, and Lighting.
Updating Standards and Labels Standards and labels must be continually reviewed and revised (3-5 years) to increase stringency and drive continued energy savings. • As new energy saving technologies are developed and become more cost effective it is important to continually update the stringency of standards. • Once the market has become oversaturated with high energy efficient products it is necessary to increase the stringency of label requirements in order to keep labels meaningful to consumers. Source: CLASP, Feb 2005, Energy-Efficiency Labels and Standards: A Guidebook for Appliances, Equipment, and Lighting.
Seven Steps in S&L Development Source: CLASP, Feb 2005, Energy-Efficiency Labels and Standards: A Guidebook for Appliances, Equipment, and Lighting.
S&L Programs Require Resources • Legal and Authoritative Resources • Clear mandates and lines of responsibility from framework legislation and/or implementing regulation • Financial • A regular and consistent source of operational budgets; annual allocations? Fees from testing and/or labeling? • Human Resources • Qualified staff to manage implementation as well as conduct market analysis; some outsourcing possible but base management requires dedicated staff • Physical/Facilities • Central offices, field facilities for monitoring/enforcement and/or laboratories for testing? • Institutional • All of the above should culminate in a managing institution with program responsibility
Common Challenges in the Test Lab and Testing Arena • Finding the financial resources for a bricks and mortar (versus policy) project • Getting the order right—need the test lab and procedure before you can regulate • Defining the Business Model • Limited amount of mandatory testing to support business model • How to leverage private R&D testing to support the business model • Test Standards and Test Methods • Lack details required to perform tests in the same way across multiple laboratories • Do not address innovation and emerging technologies • Test Procedure development not synced well in advance of regulations • Test Procedures “Slow to Change” • Allow “Gaming” during the test process that influence results • Correlation between laboratories • Uncertainty and Repeatability of test results • Difference in Field Data Results vs. Lab Data Results • Cost of testing
Need a Model to Prioritize: India Example ANALYSIS 1: Based on GHG Abatement Potential in India GHG abatement Potential • The model compares GHG Abatement Possible in year 2030 due to application of S&L to the considered products = • The products sold on or after 2014 and surviving till year 2030 have been considered • - Normal distribution considered for products’ useful life Surviving stock X • Calculated based on Hourly Energy Consumption (daily hours of use) days of use per year Annual energy consumption X • Decided based on maximum theoretical improvement possible, depending upon present performance and specific areas of improvement e.g. in stand by and operating condition Energy saving potential of the appliance X • To facilitate comparison for different fuel types, emission factors have been used to quantify environmental impact on basis of tonnes equivalent of CO2 abated Electricity/fuel emission factor Source: CLASP&EDS, 2010, Product Prioritization Study
Multiple Scenarios Can Be Analyzed ANALYSIS 2: Based on GHG Abatement Potential and Market Implementability - Both in India Need • The product may have high overall GHG abatement potential but the actual implementation of effective labeling program may be difficult due to a host of market and management factors • Therefore, we need to include these as well to ensure a more realistic analysis • A normalized score for GHG abatement potential is calculated. • We also calculate the score for ‘market implementability’ (market implementability index) • A weighted score for both the parameters gives the ranking for products Basis • Market Implementability index is calculated based on following parameters: • Test Procedures / Standards • Number of stakeholders (manufacturers) • % organized sector • Implementing association/ partner Calculation of Market Implementability index The Products are given a score on a scale of 0-4 (0=worst, 4= best) for all these parameters and final scores calculated based on parameter weight and score Source: CLASP&EDS, 2010, Product Prioritization Study
Good Label Design Requires Market Research with Stakeholders—Particularly Consumers • Even though the Ghana program was one of our smallest (~$110,00 per year) CLASP provided T.A. for market research for Ghana label design • Small sample of consumer focus groups • Categorical design based on stars was most influential • Colors and star design reminiscent of Ghana flag to identify labeling as a national program
Compliance & the MV&E Regime • All S&L programs have rules • Mandatory and voluntary programs • Contained in legislation or administrative guidelines • Compliance means adherence to these sets of rules • Obligations may apply to different stakeholders: suppliers, importers, retailers, wholesalers, on-line suppliers, etc • Rules adopted by different programs vary according to many factors • Existing legislation, political ambition, national governance issues, resources (in-house and external), stakeholder attitudes, etc. • But all programs have processes and systems to check compliance – the “compliance regime” • This regime (should) comprise several distinct but interrelated elements
Key Elements • Designing for, and facilitating, compliance • Market surveillance (monitoring) • Verification testing • Enforcement • Communication • Legal and administrative framework • Budget • Evaluation • All elements have to be included for the system to • work and the required outcomes achieved.
Why Worry About Compliance? • Safeguard the investment made by governments in building up the credibility of their voluntary and mandatory energy labels; • Risk that failure to address non-compliance can lead to serious long-term consequences through the erosion of consumer confidence; • Will require a considerable effort to re-establish credibility; • Consumers pay for performance that they do not receive; • Safeguard the investment made by compliant industry participants in order to manufacture and supply energy efficient products; • Without adequate enforcement, the compliant industry participant is penalised through a loss of economic returns and competitive advantage - leading to a disincentive to invest in innovation.
The Circle of Compliance Source: CLASP, Sep 2010, Compliance Counts- A Practitioner’s Guidebook on Best Practice Monitoring, Verification, and Enforcement for Appliance Standards & Labeling
How Good are We at Ensuring Compliance? CLASP Research • CLASP surveyed S&L programs in G20 countries (+Tunisia & Chile) and found 30 programs spanning 14 countries • Comparison with surveys of EU Member States • To assess the strengths and weaknesses of the compliance infrastructure and capacity • To provide a greater level of evidence to support efforts to tackle compliance Source: CLASP& Mark Ellis & Associates, Jun 2010, A Survey of Monitoring, Verification and Enforcement Regimes and Activities in Selected Counties
Resources Key: M = MEPS M&L = MEPS and Labelling TR = Top Runner VL = Voluntary Labelling ML = Mandatory Labelling n/a = not available • 50% programs can say how much is spent on compliance per annum • In these, the amounts vary • Few have defined budget allocations and forward plans for MV&E activities • Fewer programs gave staff numbers. MV&E often forms part of staff’s functions • Need to ensure activities are coordinated and recorded; and clear lines of responsibility established Source: CLASP& Mark Ellis & Associates, Jun 2010, A Survey of Monitoring, Verification and Enforcement Regimes and Activities in Selected Counties
MV&E Activities • 80% programs undertake product testing • 50% could give figures Key: M = MEPS M&L = MEPS and Labelling TR = Top Runner VL = Voluntary Labelling ML = Mandatory Labelling n/a = not available Source: CLASP& Mark Ellis & Associates, Jun 2010, A Survey of Monitoring, Verification and Enforcement Regimes and Activities in Selected Counties
MV&E Activities • Very few were able to provide figures for enforcement actions • Labeling and similar offences found in market surveillance • Performance verification tests Source: CLASP& Mark Ellis & Associates, Jun 2010, A Survey of Monitoring, Verification and Enforcement Regimes and Activities in Selected Counties
MV&E Activities • Public disclosure • Compliance assessment Source: CLASP& Mark Ellis & Associates, Jun 2010, A Survey of Monitoring, Verification and Enforcement Regimes and Activities in Selected Counties