Download
1 / 26
270 likes | 375 Views
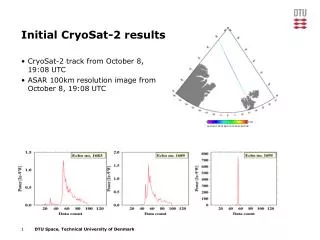
Initial Results of EIS. Shinsuke Imada (NAOJ) EIS Team. EIS. SOT. XRT. HINODE Spacecraft. HINODE (which was called SOLAR-B before launch) was successfully launched on 23 Sep, 2006. Observations started from the beginning of Nov 2006. The Instrument. Wavelength bands 170Å-210Å 250Å-290Å

E N D
Initial Results of EIS Shinsuke Imada (NAOJ) EIS Team
EIS SOT XRT HINODE Spacecraft • HINODE (which was called SOLAR-B before launch) was successfully launched on 23 Sep, 2006. • Observations started from the beginning of Nov 2006.
The Instrument • Wavelength bands170Å-210Å250Å-290Å • Slits & slots1”, 2”, 40”, and 266” • High resolutions0.0223Å/pixel & 1”/pixel • High throughputMinimum number of reflectionMulti-layer coating of the mirrorSuitable for transient phenomena
Field of View N EIS (576”x512”) E W SOT:NFI/SP (328”x164”) SOT:BFI (205”x102”) XRT (2048”x2048”) S
Cold lines < 1MK HeII: 256.3 A (T=4.9) OV: 192.9 A (T=5.4) MgV: 276.6 A (T=5.4) FeVIII: 185.1 A (T=5.6) MgVI: 269.0A (T=5.6) MgVII:278.4A(T=5.8) SiVII:275.4A(T=5.8) FeX:184.5A(T=6.0) Young et al (2007)
Hot lines >1MK FeXI: 188.2 A (T=6.1) SiX: 261.0 A (T=6.1) FeXII: 195.1 A (T=6.1) FeXIII: 202.0 A (T=6.2) FeXIV: 264.8A (T=6.3) FeXV:284.2A(T=6.3) FeXVI:263.0A(T=6.4)
Emission Measure Flare Active Region QUIET SUN Watanabe et al (2007)
Active Region 0.4 MK 2.5 MK Multi-Temperature Structure of active region. One may find that High-Temperature loops are wider than Low-Temperature loops!!
Loop Width Brooks et al (2007) The loop width is clearly depend on plasma temperature. This result is very interesting, because plasma beta is very low in solar corona.
Active Region Footpoint Hara et al (2007)
Exploring North Pole • Soft X-ray image shows many Ioop-shaped bright points in coronal hole EIS FOV
Reconnection Jet + • Flux emerging in open field structure can produce jets. • Line of sight velocity: 30km/s • Taking account of projection effect, actual velocity could be much higher ( > 300 km/s) • Is the jet connecting to solar wind? Kamio et al (2007)
Jet 1 • Light curve show the Typical Jet time profile. • Intensity rise at 15:10, and reduce slowly.
Jet2 • Light curve show Two peaks. • Hot plasma eject from bright point at ~16:35. • Middle temperature plasma are come back to BP.
Flare Observation Dec13th 2006 03:00 02:00
Intensity Filament rotation Velocity Williams et al (2007) Please note that this is observed before X-class Flare!! Trigger??
Ejection at impulsive phase Asai et al (2007)
Doppler Shift (Velocity) map FeXIV FeXV FeXII FeXIII Imada et al (2007) The upflows are observed at boundary of Transient Coronal Hole in Plage region at gradual phase of X-class flare. > 1 hour FeX HeII ~ 4.5 hour 150km/sec -150km/sec
Temperature-Dependent Upflow Upflow velocity is clearly depend on its temperature. The trend on temperature is dramatically changed ~1MK.
Dec 14th Flare Harra et al (2007)
He II 256 Fe XII 195 Fe XV 284 Ca XVII/Fe XI 192 LDE Flare Event
EIS Summary • EIS works perfectly!! • EIS observe many new solar aspects for Active region Polar coronal hole Flare Thank you very much for your attention!