Download
1 / 1
10 likes | 147 Views
Vessel track information Database Abraham Gallardo • Computer Engineer • gallardo.abraham@gmail.com Elsa Cortez • Computer Engineer • elsa23@gmail.com Mentor: Dr. Stephen Hobbs, SPAWAR Systems Center. NSF Grant #: 0653277. Introduction. Data Processing.

E N D
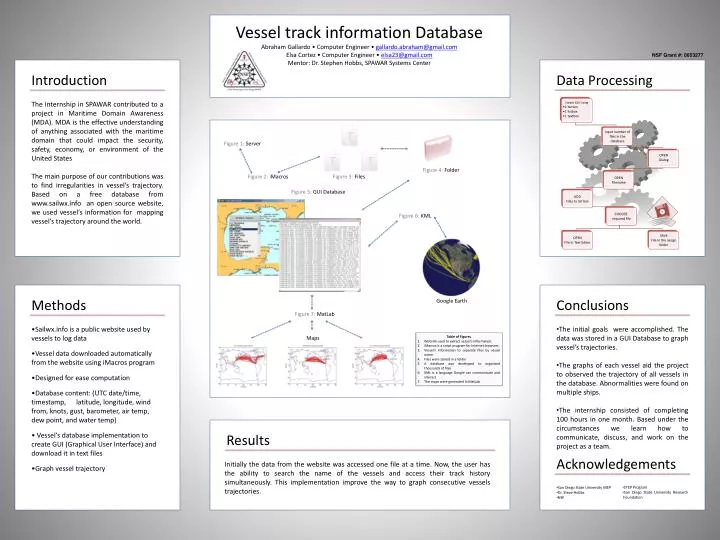
Vessel track information Database Abraham Gallardo • Computer Engineer • gallardo.abraham@gmail.com Elsa Cortez • Computer Engineer • elsa23@gmail.com Mentor: Dr. Stephen Hobbs, SPAWAR Systems Center NSF Grant #: 0653277 Introduction Data Processing The internship in SPAWAR contributed to a project in Maritime Domain Awareness (MDA). MDA is the effective understanding of anything associated with the maritime domain that could impact the security, safety, economy, or environment of the United States The main purpose of our contributions was to find irregularities in vessel’s trajectory. Based on a free database from www.sailwx.info an open source website, we used vessel’s information for mapping vessel’s trajectory around the world. Figure 1: Server Figure 4: Folder Figure 3: Files Figure 2: iMacros Figure 5: GUI Database Figure 6: KML Methods Conclusions Google Earth Figure 7: MatLab • Sailwx.info is a public website used by vessels to log data • Vessel data downloaded automatically from the website using iMacros program • Designed for ease computation • Database content: (UTC date/time, timestamp, latitude, longitude, wind from, knots, gust, barometer, air temp, dew point, and water temp) • Vessel’s database implementation to create GUI (Graphical User Interface) and download it in text files • Graph vessel trajectory • The initial goals were accomplished. The data was stored in a GUI Database to graph vessel’s trajectories. • The graphs of each vessel aid the project to observed the trajectory of all vessels in the database. Abnormalities were found on multiple ships. • The internship consisted of completing 100 hours in one month. Based under the circumstances we learn how to communicate, discuss, and work on the project as a team. Maps Table of Figures Website used to extract vessel’s information. iMacros is a script program for Internet browsers. Vessel’s information to separate files by vessel name. Files were stored in a folder A database was developed to organized thousands of files KML is a language Google can communicate and interact The maps were generated in MatLab Results Initially the data from the website was accessed one file at a time. Now, the user has the ability to search the name of the vessels and access their track history simultaneously. This implementation improve the way to graph consecutive vessels trajectories. Acknowledgements • San Diego State University MEP • Dr. Steve Hobbs • NSF • STEP Program • San Diego State University Research Foundation