Download
1 / 15
150 likes | 159 Views
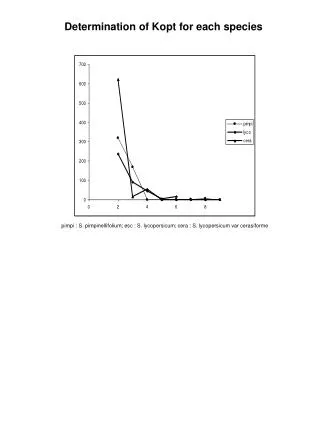
GEOCHEMICAL METHODS FOR THE DETERMINATION OF DIFFERENT METAL SPECIES. Environmental Biogeochemistry of Trace Metals (CWR6252). PART -1 pE-pH Phase Diagrams and Metal Speciation. Oxidation of water O 2 (g). Fe(OH) 2+. Fe 3+. pE. Fe 2+. Reduction of water H 2 (g). pH.

E N D
GEOCHEMICAL METHODS FOR THE DETERMINATION OF DIFFERENT METAL SPECIES Environmental Biogeochemistry of Trace Metals (CWR6252)
Oxidation of water O2(g) Fe(OH)2+ Fe3+ pE Fe2+ Reduction of water H2(g) pH CASE STUDY: The IRON-WATER System pE=20.8-pH pE=-pH Preliminary: Set boundaries where water is stable
Constructing a pE-pH diagram Step 1: Identify the most common species of the element in the given system (example system: Fe – H2O) Step 2: Collect the tabulated ΔGof data for each of the above species Step 3: Write and balance reactions between species Step 4: Calculate Gibbs free energy (ΔGoR) for these reactions Step 5: Calculate logKeq for each reaction Step 6: Calculate pE0for redox reactions Step 7: Write the expression for equilibrium constant (keq) for each reaction Step 8: Derive the boundary equation between species from Keq expressions by rearranging and substituting known values Step 9: Plot the boundary equation on the diagram
Constructing the pE-pH diagram for Fe-H20 system Step 1: Identify the most common species of the element in the given system Step 2. Look up the thermodynamic data for each specie (ΔGof) link
(a) Vertical Line Fe3+/FeOH2+ Step 3. Write and balance reactions between species starting with oxidized species Fe3++H2O=FeOH2++H+ Step 4. Calculate the standard Gibbs free energy of rxn (ΔGoR) = (-233.2+0)-(-8.56-237.18)=12.54 kJ/mol Step 5.Calculate logKeq = -12.54/5.708= -2.2 kJ/molat 25oC
(a) Example of a Vertical Line Fe3+/FeOH2+ Step 6:Skip for this reaction (not a redox) Step 7:Write the expression for the equilibrium constant (keq) Step 8: Derive the boundary equation by taking the log of both sides, re-arranging, and then substituting with known values since [FeOH2+]=[Fe3+] at equilibrium and pH=-log[H+], then a vertical line Step 9: Plot the Fe3+/FeOH2+ boundary equation pH=2.2
(b) Example of a Horizontal Line Fe3+/Fe2+ Step 3: Fe3++ e- = Fe2+ = (-82.88)-(-8.56+0)= -74.32 kJ/mol = 74.32/5.708= 13 , n is the number of electrons Step 4: Step 5: Step 6:
(b) Example of a Horizontal Line Fe3+/Fe2+ Step 7: Step 8: Take the log of the equation and divide by the number of electrons (in this case n=1) Since [Fe2+]=[Fe3+], pE=-log[e-], and then pE = pE0 = 13 horizontal line Step 9: Plot the Fe3+/Fe2+boundary equation pE = 13
(c) Example of a Diagonal Line FeOH2+/ Fe2+ Step 3:FeOH2++e- +H+= Fe2++H2O Step 4: =(-82.88-237.18)-(-233.20+0+0)= -86.86 kJ/mol Step 5: =86.86/5.708=15.2 Step 6: where n is the number of electrons transferred in the redox reaction
Diagonal Line Cont’d Step 7: Step 8: Take the log of the equation and divide by the number of electrons (in this case n =1) Since pE=-log[e-], pH=-log[H+], [Fe2+]=[FeOH2+], [H2O]=1, and diagonal line Step 9: Plot the Fe2+/FeOH2+boundary equation pE=15.2-pH
Oxidation of water O2(g) Fe(OH)2+ Fe3+ pE Fe2+ Reduction of water H2(g) pH Equations of the Different Boundary Lines for the Fe-H2O system
Example pE-pH Diagrams Trace metals in Simple Aqueous Systems1. Zinc, Cadmium, and Lead at 250C and 1 atm Pb-CO2-S-O-H2O system Zn-CO2-S-O-H2O system Cd-CO2-S-O-H2O system
2. Arsenic and Selenium at 250C and 1 atm As-O-S-H2O system Se-O-H2O system