GraphX : Graph Analytics on Spark
680 likes | 1.63k Views
GraphX : Graph Analytics on Spark. Joseph Gonzalez, Reynold Xin , Ion Stoica , Michael Franklin Developed at the UC Berkeley AMPLab AMPCamp : August 29, 2013. Graphs are Essential to Data Mining and Machine Learning. Identify influential people and information Find communities

GraphX : Graph Analytics on Spark
E N D
Presentation Transcript
GraphX:Graph Analytics on Spark Joseph Gonzalez, ReynoldXin, Ion Stoica, Michael Franklin Developed at the UC Berkeley AMPLab AMPCamp: August 29, 2013
Graphs are Essential to Data Mining and Machine Learning • Identify influential people and information • Find communities • Understand people’s shared interests • Model complex data dependencies
Predicting Political Bias ? ? Liberal Conservative ? ? ? ? ? ? ? ? ? Post ? Post Post Post ? Post Post Post Post ? Post Post Post Post ? ? ? Post ? Post ? ? ? Post ? Post Post Post Post Conditional Random Field Belief Propagation Post Post Post ? ? ? ? ? ? ? ?
Triangle Counting • Count the triangles passing through each vertex: • Measures “cohesiveness” of local community 1 3 2 4 Fewer Triangles Weaker Community More Triangles Stronger Community
Collaborative Filtering Users Items Ratings
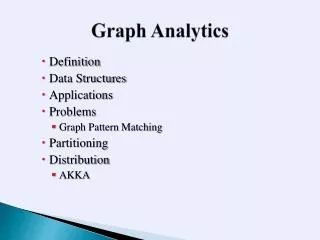
Many More Graph Algorithms • Collaborative Filtering • Alternating Least Squares • Stochastic Gradient Descent • Tensor Factorization • SVD • Structured Prediction • Loopy Belief Propagation • Max-Product Linear Programs • Gibbs Sampling • Semi-supervised ML • Graph SSL • CoEM • Graph Analytics • PageRank • Single Source Shortest Path • Triangle-Counting • Graph Coloring • K-core Decomposition • Personalized PageRank • Classification • Neural Networks • Lasso …
Structure of Computation Data-Parallel Graph-Parallel Table Dependency Graph Row Row Result Row Row Pregel
The Graph-Parallel Abstraction A user-defined Vertex-Programruns on each vertex Graph constrains interaction along edges Using messages (e.g. Pregel[PODC’09, SIGMOD’10]) Through shared state (e.g., GraphLab[UAI’10, VLDB’12]) Parallelism: run multiple vertex programs simultaneously
By exploiting graph-structureGraph-Parallel systems can be orders-of-magnitude faster.
Triangle Counting on Twitter 40M Users, 1.4 Billion Links Counted: 34.8 Billion Triangles Hadoop[WWW’11] 1536 Machines 423 Minutes 64 Machines 15 Seconds 1000 x Faster GraphLab S. Suri and S. Vassilvitskii, “Counting triangles and the curse of the last reducer,” WWW’11
Specialized Graph Systems Pregel
Specialized Graph Systems • APIs to capture complex graph dependencies • Exploit graph structuretoreduce communicationand computation
The Bigger Picture Post Proc. Hadoop Graph Algorithms GraphLab Graph Creation Time Spent in Data Pipeline
Edges Edges
Limitations of Specialized Graph-Parallel Systems • No support for Construction & Post Processing • Not interactive • Requires maintaining multiple platforms Spark excels at these!
GraphXUnifies Data-Parallel and Graph-Parallel Systems SparkTable API RDDs, Fault-tolerance, and task scheduling GraphLabGraph API graph representation and execution one system for the entire graph pipeline Graph Construction Computation Post-Processing
EnableJoiningTables and Graphs Inf. ETL Join User Data Prod. Rec. Friend Graph Product Rec. Graph Product Ratings Tables Graphs
GraphX API class Graph [ V, E ] { // Table Views ----------------- defvertices: RDD[ (Id, V) ] defedges: RDD[ (Id, Id, E) ] deftriplets: RDD[ ((Id, V), (Id, V), E) ] // Transformations ------------------------------ defreverse: Graph[V, E] deffilterV(p: (Id, V) => Boolean): Graph[V,E] deffilterE(p: Edge[V,E] => Boolean): Graph[V,E] defmapV[T](m: (Id, V) => T ): Graph[T,E] defmapE[T](m: Edge[V,E] => T ): Graph[V,T] // Joins ---------------------------------------- defjoinV[T](tbl: RDD[(Id, T)]): Graph[(V,Opt[T]), E ] defjoinE[T](tbl: RDD[(Id, Id, T)]): Graph[V, (E,Opt[T])] // Computation ---------------------------------- defaggregateNeighbors[T](mapF: (Edge[V,E]) => T,reduceF: (T, T) => T, direction: EdgeDir): Graph[T, E] }
Aggregate Neighbors B C • Map-Reduce for each vertex • mapF( ) a1 A • mapF( ) a2 D E A A B C • reduceF( , ) A a1 a2 F
Example: Oldest Follower 23 42 B C • What is the age of the oldest follower for each user? • valfollowerAge =graph.aggNbrs( e => e.src.age, // MapF max(_, _), // ReduceFInEdges).vertices 30 A D E 19 75 F 16
We can express both Pregel and GraphLab using aggregateNeighbors in 40 lines of code!
Performance Optimizations • Replicate & co-partition vertices with edges • GraphLab (PowerGraph) style vertex-cut partitioning • Minimize communication by avoiding edge data movement in JOINs • In-memory hash index for fast joins
In ProgressOptimizations • Byte-code inspection of user functions • E.g. if mapfdoes not need edge data, we can rewrite the query to delay the join • Execution strategies optimizer • Scan edges randomly accessing vertices • Scan vertices randomly accessing edges
Current Implementation PageRank (5) Connected Comp. (10) Shortest Path (10) ALS (40) Pregel (20) GraphLab (20) GraphX Spark (relational operators)
Demo ReynoldXin
Summary • Graph-parallel primitives on Spark. • Currently slower than GraphLab, but • No need for specialized systems • Easier ETL, and easier consumption of output • Interactive graph data mining • Future work will bring performance closer to specialized engines.
Status • Currently finalizing the APIs • Feedback wanted: http://bit.ly/graph-api • Also working on improving system performance • Will be part of Spark 0.9
Questions? jegonzal@eecs.berkeley.edu rxin@eecs.berkeley.edu
Example: Vertex Degree A: 5 B: 0 C: 0 D: 0 E: 0 F: 0
Example: Oldest Follower B C • What is the age of the oldest follower for each user? • valfollowerAge =graph.aggNbrs( e => e.src.age, // MapF max(_, _), // ReduceFInEdges).vertices A D E F
Specialized Graph Systems Pregel Shared State [UAI’10, VLDB’12] Messaging [PODC’09, SIGMOD’10] Many Others Giraph, Stanford GPS, Signal-Collect, Combinatorial BLAS, BoostPGL, …
GraphX API class Graph [ V, E ] { // Table Views ----------------- defvertices: RDD[ (Id, V) ] defedges: RDD[ (Id, Id, E) ] deftriplets: RDD[ ((Id, V), (Id, V), E) ] // Transformations ------------------------------ defreverse: Graph[V, E] deffilterV(p: (Id, V) => Boolean): Graph[V,E] deffilterE(p: Edge[V,E] => Boolean): Graph[V,E] defmapV[T](m: (Id, V) => T ): Graph[T,E] defmapE[T](m: Edge[V,E] => T ): Graph[V,T] // Joins ---------------------------------------- defjoinV[T](tbl: RDD[(Id, T)]): Graph[(V,Opt[T]), E ] defjoinE[T](tbl: RDD[(Id, Id, T)]): Graph[V, (E,Opt[T])] // Computation ---------------------------------- defaggregateNeighbors[T](mapF: (Edge[V,E]) => T,reduceF: (T, T) => T, direction: EdgeDir): Graph[T, E] }