Download
1 / 1
10 likes | 74 Views
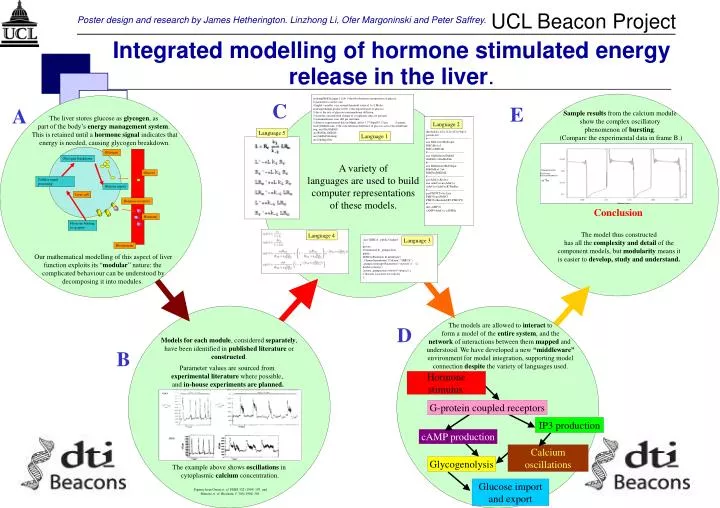
cAMP production. Hormone stimulus. Models for each module , considered separately , have been identified in published literature or constructed. Glycogenolysis. G-protein coupled receptors. IP3 production. nodearg(BldGlu,input,1.2e4) // the bloodstream concentration of glucose

E N D
cAMP production Hormone stimulus. Models for each module, considered separately, have been identified in published literature or constructed. Glycogenolysis G-protein coupled receptors IP3 production nodearg(BldGlu,input,1.2e4) // the bloodstream concentration of glucose // parameter is molar conc // highly variable, vary around threshold value of 1e-2 Molar nodearg(GluImp,product,0.03) // the import/export of glucose // this is the rate of glucose transmembrane diffusion, // in molar concentration change of cytoplasmic glucose per unit // transmembrane conc diff per unit time. // fitted to experimental data in Munk, and is 1.73 $\pm$ 0.13 per // minute node(GluDiff,sum) // the concentration difference of glucose across the membrane. neg_arc(Glu,GluDiff) arc(BldGlu,GluDiff) arc(GluDiff,GluImp) arc(GluImp,Glu) threshold(x,xT)=1/(1+(xT/x)^hilcf) par hilcf=8 #--------------------------------------------- aux BldCaout=BldCapar BldCaK=1e3 BldCa=BldCaK #-------------------------------------- aux GluDiffout=GluDiff GluDiff=-Glu+BldGlu #-------------------------------------- aux BldGluout=BldGlupar BldGluK=1.2e4 BldGlu=BldGluK #-------------------------------------- par AdnCycK=4e-1 aux AdnCycout=AdnCyc AdnCyc=AdnCycK*BetRec #-------------------------------------- par PMI3TT=5e-2aux PMI3Tout=PMI3T PMI3T=threshold(IP3,PMI3TT) #-------------------------------------- init cAMP=0 cAMP'=AdnCyc-cAMPde class SERCA : public Channel { private: ContinuousI & _pumpaction; public: SERCA(Boundary & membrane) : Channel(membrane,"Calcium","SERCA"), _pumpaction(regt<Parameter>("Activity")) {} double velocity() {return _pumpaction->show()*outspec();} // inwards is positive for velocity }; Glucose import and export Calcium oscillations UCL Beacon Project Poster design and research by James Hetherington. Linzhong Li, Ofer Margoninski and Peter Saffrey. Integrated modelling of hormone stimulated energy release in the liver. C E A Sample results from the calcium module show the complex oscillatory phenomenon of bursting. (Compare the experimental data in frame B.) The liver stores glucose as glycogen, as part of the body’s energy management system. This is retained until a hormone signal indicates that energy is needed, causing glycogen breakdown. Language 2 Language 5 Language 1 Glycogen Glycogen breakdown A variety of languages are used to build computer representations of these models. Glucose Cellular signal processing Glucose export Liver cell Hormone receptors Conclusion Hormone Hormone binding to receptor The model thus constructed has all the complexity and detail of the component models, but modularity means it is easier to develop, study and understand. Language 4 Language 3 Bloodstream Our mathematical modelling of this aspect of liver function exploits its “modular” nature: the complicated behaviour can be understood by decomposing it into modules. The models are allowed to interact to form a model of the entire system, and the network of interactions between them mapped and understood. We have developed a new “middleware” environment for model integration, supporting model connection despite the variety of languages used. D B Parameter values are sourced from experimental literature where possible, and in-house experiments are planned. The example above shows oscillations in cytoplasmic calcium concentration. Figures from Green et. al. FEBS 322 (1993) 197, and Marrero et. al. Biochem. J. 300 (1994) 383.