Download

1 / 47
470 likes | 645 Views
Testing for mediating and moderating effects with SAS. Contingency / elaboration / 3rd variable models. One best management practice vs. contingency perspective Failure to find main effects -> use of moderators

E N D
Contingency / elaboration / 3rd variablemodels One best management practice vs. contingencyperspective Failure to find main effects -> use of moderators Morethan 50% of empiricalstrategyresearchhave a contingencyelementnowadays • Venkatraman 1989 main types: • Interactionmoderation • Subgroupmoderation • Mediation • Configurations, gestalt (clusteranalysis) Footer
Contingency / elaboration / 3rd variablemodels Fairchild et al 2007, AnnualReview of Psychology 58: 593-614 Thirdvariablecouldbe • Mediator x-> z -> y • Confoundingvariable x <- z -> y (lead to spuriousx-yrelationship) • Covariate x -> y <- z or z -> x -> y • Moderator / interaction Footer
MediationMathieu et al 2008, Org. Res. Meth.http://davidakenny.net/cm/mediate.htm • X -> M -> Y • Underlyingmechanismthroughwhich X predicts Y • Baron & Kenny (1986) Journal Of Personality and Social Psych., 51, 1173-1182
Mediation, examplesMathieu et al 2008, Org. Res. Meth. • Structure – strategy – performance (IO paradigm) • Strategy – structure – performance (Chandler) • Theory of reasoned action (Ajzen) • Technology adoption model (Davis) • RBV
Mediation e3 Mediatingvariable M a b e2 Independentvariable X Dependentvariable Y c’ Y = i1 + cX + e1 Y = i2 + c’X + bM + e2 M = i3 + aX + e3
Mediation Causalsteps (Baron & Kenny 1986): • Y = i1 + cX + e1 • Y = i2 + c’X + bM + e2 • M = i3 + aX + e3 Full of partialmediationexistswhen… • cis significant • ais significant • bis significant • c’is smallerthan c
Mediation, assumptions • Residuals in eq 2 and 3 areindependent • M and residual in eq 2 areindependent • No XM interaction in eq 2 • No misspecification • Causalorderx->m->ynoty->m->x • Causaldirectionm<->y • Unmeasuredvariables • Measurementerror
Size of Mediation, indirect effect total effect = direct effect + indirect effect c = c’ + ab You can calculate either c – c’ from equations 1 and 2 or ab from equations 2 and 3 and test for significance using z-distribution Standard error for the indirect effect by Sobel 1982, works ok with samples n>100, but is very conservative (low power) Sobel test tool in web http://quantpsy.org/sobel/sobel.htm
Pierceet al. (2004) Workenvironmentstructure and psychologicalownership: the mediatingeffects of control. The journal of social psychology, 144(5):507-534 Linear regression Gassenheimer & Manolis (2001) The influence of productcustomization and supplierselection on futureintentions: the mediatingeffects of salesperson and organizationaltrust. Journal of managerialissues, 13(4):418-435 LISREL Mediation examples
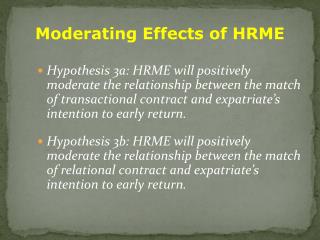
Mediation, examplePierce et al 2004 Hypothesis A: controlmediates the relationshipbetween WES and ownership Hypothesis B: controlmediates the relationshipbetweentech and ownership
Mediation, example with SAS Assign the library TILTU12 Open the datasetData_med_mod Test a model, whereknowledgesharing is expected to mediate the effect of collaboration on innovativeperformance • Use the Baron & Kennycausalsteps to estimate the model • Use the Sobeltestcalculator to test the significance of the indirecteffect
Step 1 Footer
Step 1 Footer
Step 2 Footer
Step 2 Footer
Step 3 Footer
Step 3 Footer
Indirecteffect & Sobeltest • http://quantpsy.org/sobel/sobel.htm • From the SAS output youget a= .596, b=.05, c=.066 and c’=.043 • Input the a valuefromstep 3 and itsstderror • Input the b valuefromstep 2 and itsstderror • The calculatorshows • the teststatistic z = ab / stderror of ab • stderror of ab • Significancetestthat ab differsfromzero • Note: the calculatordoesnot show the value of ab (.596 * .05 in this case) Footer
Indirecteffect & Sobeltest http://quantpsy.org/sobel/sobel.htm Footer
Moderationhttp://davidakenny.net/cm/moderation.htm A predictorhas a differentialeffect on the outcomevariabledepending on the level of the moderatorvariable Guidelines for testing in Sharma et al (1981) JMR 18(3):291-300 Venkatraman 1989, AMR 14:423-444 Footer
Moderation Homologizer: Errorterm is function of z, R square is dependent on z If the sample is split into subgroupsaccording to values of z, weobservedifferent R squares in the subgroups Pure and Quasimoderator: The regression coefficient of x is a function of z Pure y = a + b1 x + b2 xzor y = a + (b1 + b2 z)x Quasi y = a + b1 x + b3z + b2xz -> either x or z canbe the moderator A. Subgroupanalysis Split the sample into subgroupsbased on the moderator (z) and run the x-ymodelseparately in eachsubgroup Compare the R squares (and/orparameterestimates) of the subgroups, Chowtestcanbeused for testing the significance of the difference in R squares Difference in parameterestimates d= B1 – B2 Standard error of the differenceSEd= SQRT (SEB12 + SEB22) If |d| > 1.96* SEd, it is significant at p<.05 Footer
Moderation B: MRA (interaction) The variablesshould (maybe, seeEchambadi & Hess 2004) bemean-centered (orresidual-centered, seeLance 1988) to avoidcollinearity • Y = a + b1 x • Y = a + b1 x + b2 z • Y = a + b1 x + b2 z + b3xz Interpretation: Z is a predictorifb3= 0 and b2≠ 0 Z is a pure moderatorifb2= 0 and b3≠ 0 Z is a quasimoderatorifb2≠ 0, ja b3≠ 0 Usegraphics to help interpretation of results
Moderation Summary, firstrun MRA • Ifxz-interaction is significant • If the main effect of z is significant -> quasi • If the main effect of z is notsignificant -> pure • Ifxz-interaction is notsignificant • If the main effect of z is significant->predictor • If the main effect of z is notsignificant, and z is unrelatedwith x -> split into subgroupsbased on z and runx-y regression • If the R square is different in the subgroups -> homologizer • If the R square is notdifferent in the subgroups -> z plays no role Examples: Wiklund & Shepherd (2005) Entrepreneurialorientation and small business performance: a configurationalapproach. Journal of business venturing, 20(1):71-91 Rasheed (2005) Foreignentrymode and performance: The moderatingeffects of environment. Journal of small business management, 43(1):41-54
Dataset TAPDATA Examine the relationshipsbetween an individual’ssex, height, and the parents’ heights Main effects Interactioneffect of parents’ heights? Is sex a moderator, and whattype of moderator? Firstassign the library and thenopen the data and create a scatterplot SAS example on moderation
Data transformations Create a new file into yourlibraryselectingonlyvariablesyouwillneed (sukup, pituus, isanpit, aidipit) Add a computedcolumncalledmale, whereyouhaverecodedsukup= 2 as 0 Sort the data according to the variablemale
Model diagnostics & SAS code PROC REG DATA=tiltu12.recodedsorted_tap PLOTS(ONLY)=ALL ; Linear_Regression_Model: MODEL pituus = male isanpit aidipit /SELECTION=NONE SCORR1 SCORR2 TOL SPEC ; RUN;
Output Significantmodel, high R square, homoskedastic, allparameterssignificant, no collinearity
Test the significance of interaction using SAS code PROC REG DATA=TILTU12.INTER_STD_TAP PLOTS(ONLY)=ALL ; MODEL pituus = malestnd_isanpitstnd_aidipit; MODEL pituus = malestnd_isanpitstnd_aidipitmom_dad; test mom_dad=0; RUN;
Use the fileinteraktio_simple.xls Standard deviationsare 6.676 for dad and 5.220 for mom (bothmeansare 0) Meanvalue for Male is .346 Plot the interaction
Output: R square seems better for men and mom’s height more important for men
Chow test proves that models for men and women are different (data must be sorted!) PROC AUTOREG DATA=TILTU12.INTER_STD_TAP PLOTS(ONLY)=ALL ; MODEL pituus = stnd_isanpitstnd_aidipit /CHOW=(83) ; RUN;
d = bmen– bwomen Standard error for differenceSEd= SQRT (SE bmen2+ SE bwomen2) Testvalue z= d/SEdthencompare z to standardnormal d= .73 - .45 = .28 SEd= sqrt (.1182 + .0962)= sqrt (.023)= .152 Z= 1.84 < 1.96 notsignificant at 5% level Is the effect of mom different for men and women?