Download
1 / 22
240 likes | 412 Views
Polaris: A System for Query, Analysis and Visualization of Multi-dimensional Relational Databases. Chris Stolte and Pat Hanrahan Computer Science Department Stanford University. Motivation. Large multi-dimensional databases have become very common corporate data warehouses Amazon, Walmart,…

E N D
Polaris: A System for Query, Analysis and Visualization of Multi-dimensional Relational Databases Chris Stolte and Pat Hanrahan Computer Science Department Stanford University
Motivation • Large multi-dimensional databases have become very common • corporate data warehouses • Amazon, Walmart,… • scientific projects: • Human Genome Project • Sloan Digital Sky Survey • Need tools for exploration and analysis of these databases
The Pivot Table Interface • common interface to data warehouses • simple interface based on drag-and-drop • generate text tables from databases:
Polaris: Extending the Pivot Table Interface • generate rich table-based graphical displays rather than tables of text • single conceptual model for both graphs and tables • preserve ability to rapidly construct displays
Polaris Design Goals • Interactive analysis and exploration versus static visualization • Simple, consistent interface
Design Goal: Analysis & Exploration • Want to extract meaning from data • Process of hypothesis, experiment, and discovery • Path of exploration is unpredictable
Requirements on UI for Analysis and Exploration • Data dense displays: display both many tuples & many dimensions • Multiple display types: different displays suited to different tasks • Exploratory interfaces: rapidly change data transformations and views
Design Goal: Simple, Consistent Interface • Excel Pivot tables provide a simple interface for building text-based tables • Graphs require multiple steps: different interfaces and conceptual models • Want to unify tables, graphs, and database queries in one interface
Polaris Demo
Design Decision: Use a Formalism • Why a formalism? • unification: unify tables and graphs • expressiveness: build visualizations designers did not think of • interface simplicity: clearly defined semantics and operations • code simplicity: composable language versus monolithic objects
Polaris Formalism • Interface interpreted as visual specification in formal language that defines: • table configuration • type of graphic in each pane • encoding of data as visual properties of marks • Specification compiled into data & graphical transformations to generate display
Formalism Example: Specifying Table Configurations • Interface: define table configuration by dropping fields on shelves • Formalism: shelf content interpreted as expressions in table algebra • Can express extremely wide range of table configurations
Formalism Example: Specifying Table Configurations • Operands are the database fields • each operand interpreted as a set {…} • quantitative and ordinal fields interpreted differently • Three operators: • concatenation (+), cross (X), nest (/)
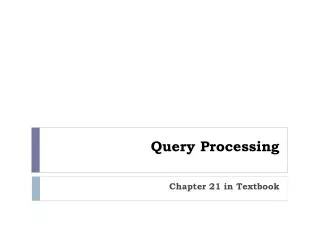
Quarter 1 Quarter 2 Quarter 3 Quarter 4 31,400 35,600 37,120 30,900 Profit (in thousands) 10 20 30 40 50 60 Table Algebra: Operands • Ordinal fields - interpret domain as a set that partitions table into rows and columns: QUARTER = {Quarter1,Quarter2,Quarter3,Quarter4} • Quantitative fields – treat domain as single element set and encode spatially as axes: PROFIT = {P[0 - 65,000]}
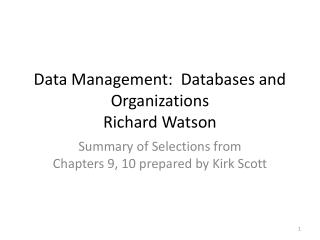
QUARTER + PRODUCT_TYPE = {QTR1,QTR2,QTR3,QTR4} + {Coffee, Tea} = {QTR1,QTR2,QTR3,QTR4, Coffee, Tea} Quarter 1 Quarter 2 Quarter 3 Quarter 4 Coffee Tea 31,400 35,600 37,120 30,900 37,120 30,900 Profit (in thousands) Sales (in thousands) 10 20 30 40 50 60 20 40 60 80 100 120 Table Algebra: Concatenation (+) Operator • Ordered union of set interpretations: PROFIT + SALES = {P[0-65,000], S[0-125,000]}
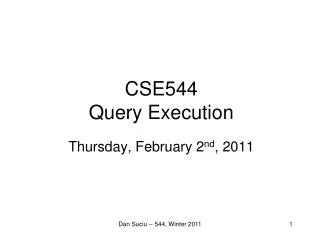
Quarter 1 Quarter 2 Quarter 3 Quarter 4 Coffee Tea Coffee Tea Coffee Tea Coffee Tea Coffee Tea Profit (in thousands) Profit (in thousands) 10 20 30 40 50 60 10 20 30 40 50 60 Table Algebra: Cross (X) Operator • Cross-product of set interpretations: QUARTER X PRODUCT_TYPE = {(Qtr1,Coffee), (Qtr1, Tea), (Qtr2, Coffee), (Qtr2, Tea), (Qtr3, Coffee), (Qtr3, Tea), (Qtr4, Coffee), (Qtr4,Tea)} PRODUCT_TYPE X PROFIT =
Table Algebra: Nest (/) Operator • QUARTER X MONTH • would create entry twelve entries for each quarter i.e. (Qtr1, December) • QUARTER / MONTH • would only create three entries per quarter
Formalism • Remainder of formalism defined in paper: • specification of different graph types • encoding of data as retinal properties of marks in graphs • translation of visual specification into SQL queries
Related Work • Formalisms for Graphics • Wilkinson’s Grammar of Graphics • Bertin’s Semiology of Graphics • Mackinlay’s APT • Visual Queries • Trellis display, DeVise, Visage • Table-based Visualizations • Table lens, Spreadsheet for Visualization
Wilkinson’s Grammar of Graphics • Describes formalism for statistical graphics • Different choices in the design of formalism: • non-relational data model • different operators in table algebra • Further experience necessary to fairly evaluate differences between our formalisms
Conclusions • Novel interface for rapidly constructing table-basedgraphical displays from multi-dimensional relational databases • A formalism for specifying complex graphics and tables • Interpretation of visual specifications as relational (SQL) queries and drawing operations.