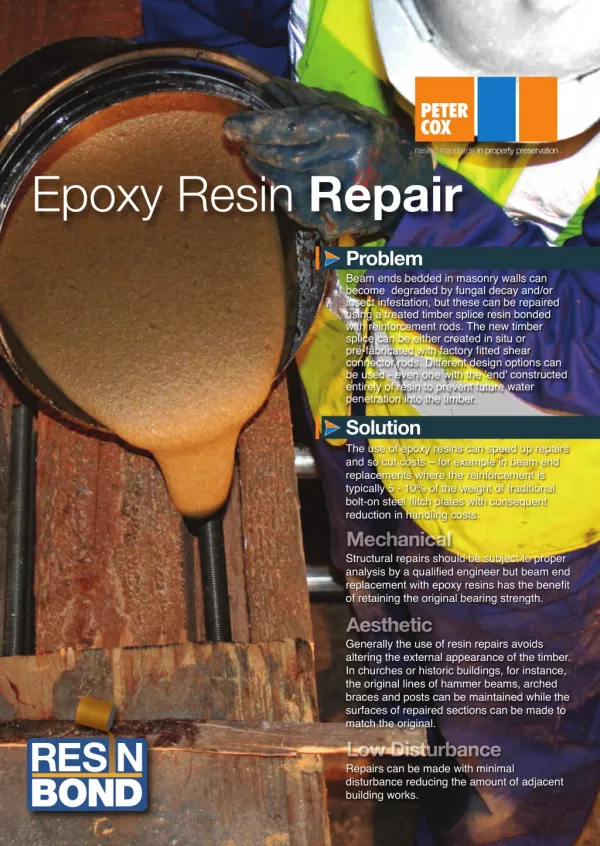
Download
1 / 24
240 likes | 377 Views
Dale A. Cox, Anne Wein, and Keith Porter Sept. 30, 2009 NSF RESIN. Multi-Hazards Demonstration Project. Fire / Debris Flow 2007 and Station Fire Post Fire Coordination Earthquake / Tsunami ShakeOut Earthquake Scenario and Tsunami Scenario

E N D
Dale A. Cox, Anne Wein, and Keith Porter Sept. 30, 2009 NSF RESIN
Multi-Hazards Demonstration Project • Fire / Debris Flow • 2007 and Station Fire Post Fire Coordination • Earthquake / Tsunami • ShakeOut Earthquake Scenario and Tsunami Scenario • Community Interface, Implementation, Tools and Training, Great Southern California ShakeOut • Winter Storm • ARkStorm Scenario
Building a Winter Storm Scenario EconomicImpacts SocialImpacts Infra-structure Emergencyresponse Flood Management Floods, Coastal Erosion, Landslides, Environmental Structures Lifelines The Storm Casualties POLICY Social Sciences Earth Science Engineering Forecasting
The ARkStorm Team • Atmospherics: Marty Ralph, NOAA Research/ESRL/PSD • Atmospherics: Mike Dettinger, USGS Scripps • Floods: Bill Croyle, DWR Flood Operations Center • Floods: Justin Ferris, USGS California Water Science Center • Landslides: Chris Wills, California Geological Survey • Landslides: Jon Stock, USGS Earth Surfaces Processes Team • Coastal: Patrick Barnard, USGS Coastal Marine Geology • Coastal: Dan Hooover, USGS Coastal Marine Geology • Physical Damages: Keith Porter, University of Colorado • Environmental: Geoff Plumlee, USGS Minerals Program • Environmental: Charles Alpers, USGS California Water Science Center • Emergency Response: Mitch Miller, CalEMA • Policy: Ken Topping, California State Polytechnic, San Luis Obispo • Economics: Anne Wein, USGS Western Geographic Team • Economics: Adam Rose, University of Southern California
Road closures over time and % average trip time increase 3 days 21% 12 days 17% 13-49 days 12% 50-140 days 8%
San Pedro Port Operation Cranes use power off the grid Cannot Separate Regional Goods • Ships wait • Few divert • Months to • clear the • back log Port has 1 week Storage
Commuting Total commuters out of PS: 8084 850 commuters to unincorporated -758 within Riverside county Total commuters into PS: 18051 3888 commuters from unincorporated 9290 live and work in Palm Springs Majority commute to and from Coachella Valley and Riverside Commuters to and from Kern and San Diego counties ignored Source: SCAG commute data based on 2000 Census Transportation Planning Package
Utility Service Outage and RestorationHigh Impact County % customers with service Telecom: up to 4 days, but congestion and delays Power: up to 1-4 months, Gas: up to 2 months, Water: up to 6 months Power,Water Telecommunications Water,Power,Gas,Transportation
Exposure: % employment located in MMI9+ EDD 2006 4th quarter data, Ben Sherrouse & David Hester (USGS) Exposure Analysis
ShakeOut Economic Costs and Impacts • Damage to Structures and Contents ($112.7b) • Fire is biggest cause • Business Interruption ($96.2b) • Water is biggest shock • Additional Costs • Relocation ($0.1b) • Traffic Delay ($4.3b)
Disaster Recovery • Phases (restoration, temporary, permanent) • Tasks, subtasks, and interdependencies • Time (pressure to return to normalcy vs. betterment)
Housing and Social Recovery region SEVERE RESIDENTIAL DAMAGE
ShakeOut Engagement of Stakeholders:Did they listen, think, act?
Category 4 CAT 4 is > 40 cm (~16 inches) in 3 days
Economics of a Natural Disaster Stabilized activity Projected activity ‘Disaster’ (a few yrs.) ‘Catastrophe’ (decades) Economic Activity Impacted economic activity Time MITIGATION Physical damage replacement Emergency Response Cumulative Losses/costs $s EMERGENCY RESPONSE PREPAREDNESS Recovery Business interruption RESILIENCE
Bridge DamageZones RESULTS Zones show estimated locations of severely damaged bridges (roadway closures ≈ 5-7 months) Roadways crossing the fault will be severely damaged (roadway closures ≈ 2 months or more) Landslide and liquefaction damage to pavement Zone 4 Palmdale San Andreas Fault San Bernadino Zone 3 Zone 2 Baldwin Park Zone 1 Riverside Palm Springs Long Beach Corona Indio Zone 5 San Juan Capistrano