Download
1 / 41
410 likes | 416 Views
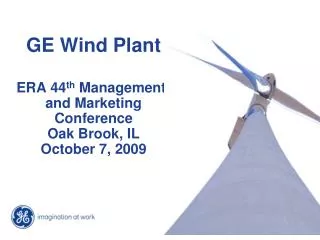
Peter Murphy, Senior Director 212/438-2065. Standard & Poor’s IPED Wind Conference. May 8, 2008. Overview. Overview of Standard & Poor’s credit ratings What is a credit rating? Public power and investor owned utilities rating distribution Public Power in a Carbon constrained World

E N D
Peter Murphy, Senior Director 212/438-2065 Standard & Poor’s IPED Wind Conference May 8, 2008
Overview • Overview of Standard & Poor’s credit ratings • What is a credit rating? • Public power and investor owned utilities rating distribution • Public Power in a Carbon constrained World • Wind and Renewable energy
What is a Credit Rating? A credit rating is Standard & Poor’s opinion of either the general creditworthiness of an obligor, or the creditworthiness of an obligor with respect to a particular debt security or other financial obligation, based on relevant risk factors.
AAA Extremely Strong AA+ AA Very Strong AA- A+ A Strong A- BBB+ BBB Adequate BBB- Investment Grade BB+ BB Vulnerable BB- B+ B More Vulnerable B- CCC+ CCC Imminent Vulnerability CCC- CC Highly Imminent Vulnerability D Default Speculative Grade Credit Ratings Scale
Public Power Utilities’ Ratings Ratings Distribution: Public Power Utilities
U.S Investor-Owned Electric Companies’ Ratings Ratings Distribution: U.S. Investor-Owned Utilities (Electric)
Key Issues • Energy Supply Challenges: Quantity, and Regulatory • Renewable Energy and Global Warming • Renewable mandates, and incentives • Challenges to wind development • Project Finance issues • “System” debt considerations • Standard & Poor’s wind project ratings • Wind Statistics
Growing Demand For Electricity • By 2030, global electricity demand expected to nearly double 2004 levels • US electricity demand projected to rise 40% by 2030 • China adding two plants per week
2005 Generation by Energy Source • Total Generation: 4.1 billion mWh • Coal: 2 billion mWh • Nuclear: 782 mWh • Natural Gas: 758 thousand mWh • Hydroelectric: 270 thousand mWh • Other Renewables: 95 thousand mWh Source: U.S. DOE EIA, October 2006
Local and Regional Initiatives • California • Assembly Bill 32 – the “California Global Warming Solutions Act” • 25 % reduction in Greenhouse Gas (GHG) by 2020 • Senate Bill 1368 • New long-term power supply contracts (with in- and out-of-state providers) from units with emissions no higher than combined cycle gas • Regional Greenhouse Gas Initiative (RGGI) • 10 Northeast & Mid-Atlantic states • Carbon Dioxide (CO2) Cap-and-Trade; Stabilize GHG emissions over 2009-2015; 10% reduction by 2019 • Midwestern Regional Greenhouse Reduction Accord • 6 States and 1 Canadian Province as signatories + 3 states as observers • Agree to long-term 60-80% reduction target via cap-and-trade
Renewable Portfolio Standards (RPS) • RPS in 27 States; 25 Mandatory • RPS applies to Public Power in 9 states: CO, MD, NC, NJ, RI, TX, VT, WA, & WI
Currently Pending Bills Lieberman-Warner (S.2191) Lieberman-McCain (S.280) Murkowski (S. 298) Bingaman-Spector (S. 1766) Waxman-Allen (H.R. 1590) Kerry-Snowe (S.485) Oliver Gilchrist (H.R.620) Udall-Petri (H.R. 509) Feinstein-Carper(S.317) Sanders-Boxer (S.309) Alexander-Lieberman (S. 1168) Others undoubtedly will follow Bill Highlights Mandatory Reductions Cap & Trade of Allowances Market Driven Price Depends on Structure and timeline for implementation Number and allocation of allowances Whether offsets will be allowed Limitations of technology Legislative outlook: after November 2008 The 110th Congress
Dead or Dying Coal Projects • On Life Support • Seminole Electric Cooperative’s Seminole Generating Station Unit 3 • Last Rites: • TXU pulls plug on eight of 11 coal units planned for Texas • Taylor Energy Center -- JEA, Tallahassee, Reedy Creek, and Florida Municipal Power Agency • OUC cancels coal gasification portion of project with the US Dept. of Energy • Sunflower Power’s Holcomb, KS unit – Tri-State and Golden Spread
Current and Continuous Efforts to Reduce Carbon • Efficiency, Conservation, Demand Side Management (DSM) • Demand reduction • Load Management • Peak shifting, shaving, or shaping • Eliminate need for nth plant or optimize electricity dispatch • Some substantial successes • Florescent bulbs, appliance efficiency, air conditioning cycling, green building, time-of-use rates, irrigation programs • Limitations: Retail, not “wholesale” reductions; behavioral changes needed for substantive reductions • Savings have plateaued
Planning the Next Generation of Generation • More efficient coal generation • Today’s coal units • Lower heat rates = less fuel needed • Less fuel = less CO2 • Springfield (ILL) City Water, Light & Power settlement with Sierra Club • Switching to less carbon intensive fuels • Great if its hydro, not so good if its natural gas or oil • GHG reduced but not eliminated • Substantial fixed costs to retro-fit or build new • Higher, more volatile commodity costs • May become more attractive if carbon tax or cap-and-trade allowance costs becomes onerous
Nuclear • Increasing interest driven by concerns about global warming and fossil fuel price and availability • Major hurdles • Poor public perception • Long lead times for approval, siting and construction • Very expensive • Insufficient loan guarantees • Bottlenecks for components • Disposal of radioactive waste • 2018+?
Integrated Gasification Combined Cycle (IGCC) • Great, but very expensive means of reducing SO2 and NOx • Real value potential for carbon capture • Without carbon capture and sequestration, not cost effective • Requires subsidization
Carbon Capture and Sequestration (CCS) • Doesn’t exist on a commercial scale yet • Technological, environmental and legal hurdles • Requires underground formations for CO2 injection • Insufficient CO2 pipeline infrastructure • Rights of way, eminent domain, inter and intra state laws • Catastrophic leakage, long term liability and insurability • Substantial costs, require subsidy to aid in development • Parasitic energy costs
Conclusion • Certain units and utilities may become uneconomical • Lack of means to reduce doesn’t seem to be slowing the mandate momentum • Currently assessing utilities exposure in light of operating and financial profiles, and focusing on management’s efforts to evaluate remedial options • Lack of exposure does not enhance credit quality • Currently may limit upward rating potential • Full financial impact remains uncertain • Full credit impact dependent on: • The ultimate legislation enacted • The remedial actions identified by management, and • The willingness and ability to pass costs onto ratepayers and maintain bondholder security
Incentives For Renewable Energy • Clean Renewable Energy Bonds (CREBS) • Production Tax Credit • Renewable Energy Production Incentive (REPI)
Clean Renewable Energy Bonds • Incentive to invest in renewable energy generation. • Generate a tax credit to be claimed against federal income taxes in lieu of interest. • Public power equivalent of Production Tax Credit. • Program oversubscribed. • Renewed by Congress on Short-term basis.
Renewable Energy Production Incentive • Before CREBS, REPI was primary renewable energy subsidy for public power. • Provides annual incentive payments (now 1.8 cents per kWh) for production of eligible renewable resources. • Incentive payments for first 10 years of operation. • Requires Congressional appropriation of funds, causing funding shortfalls.
New England • New England States are leaders in the Environmental Movement (RPS, “Reggie”). • Maine, #1 state in Non-Hydro Renewable Energy • Geothermal, Solar: Limited to Small Applications • Biomass: Wood, Solid Waste, Livestock waste. Solid Potential • Transmission and Size make Distributed Generation suitable • Wind, despite difficulties, has great potential (On and Off shore)
Obstacles to Wind • Environmental Impact Study • Bats and Birds • Transmission Concerns • NIMBY • Local Permitting • Eyesore or tourist attraction?
Avian and Bat Impact • Bird and Bat deaths caused by collisions with wind turbines. • Mortality of different species are associated with different project attributes. • Raptors at higher risk than songbirds. • Migration. Site assessments can reduce impact on birds and bats.
Transmission and Dispatch • Transmission access is major barrier to wind energy development. • Little investment in transmission lines over past 20 years. • Development of wind power project takes as little as one year, but building new transmission lines takes much longer. • Critical Congestion Areas: U.S. DOE designation of southern California and Mid-Atlantic.
Project Siting The Optimal Site • High wind speeds • Timing of wind matches needs of load • Near Transmission Infrastructure • Not on migration path Source: NREL
Project Financings – Key factors • Contract Structure Penalties, Liquidated Damages • Legal What is pledged? • Regulatory Local, State, Federal • Counterparty Contractors, Off-takers • Construction Schedule, Geographical hurdles • Technology Evolution, and risk • Operations Wind issues, Equipment • Competitive Exposure Regional pricing • Financial Debt Service Coverage
System Financing Reduces Risk • Pledge of all system revenues • Parity with other generation, transmission, and distribution debt • Wind project scale is minimal compared to total operations of the utility
Rated Wind Projects U.S. • Energy Northwest, WA, 9 Canyon Wind (Phase I, II, III) A-/Stable ** • FPL Energy American Wind LLC BBB/Stable • FPL National Wind LLC BBB-/Stable • FPL Energy National Wind Portfolio LLC BB-/Stable • FPL Wind Funding LLC (Calif, New Mexico) BB/Stable Europe • Max Two Ltd. (Breeze One) BBB-/Negative • CRC Breeze Finance S.A. (Breeze Two) BBB/Stable • Breeze Finance S.A. (Breeze Three) BBB/Stable • Alte Liebe 1 Ltd. BBB-/Stable ** rating based on 10 public utilities’ system-wide pledge
Renewable Energy Statistics
Wood/Wood Waste MSW/Landfill Gas Geothermal Solar Wind U.S. Renewable Energy Capacity U.S. Renewable Energy Capacity 2000-2006 10,000 8000 6000 Installed Capacity, MW 4000 2000 Other Biomass 0 2006 2000 2001 2002 2003 2004 2005 Year Source: U.S. DOE EIA, August 2005
Wind Cost of Energy 12 Natural Gas (fuel only) 10 8 Low wind speed sites 2006: New Wind COE (¢/kWh [constant 2000 $]) 6 New Bulk Power Competitive Price Band High windspeed sites 4 2 Depreciated Coal Depreciated Wind 1990 2010 2020 1995 2005 2015 2000 Source: NREL
Offshore Projects • 900 GW potential wind energy capacity • Near U.S. Population Centers • Stronger, Smoother Wind • High cost for installation, O&M • Need for continued technology advancements
Who is Invested in Wind? 16,100 MW total U.S. wind power capacity in 2007.
Analytic services and products provided by Standard & Poor’s are the result of separate activities designed to preserve the independence and objectivity of each analytic process. Standard & Poor’s has established policies and procedures to maintain the confidentiality of non-public information received during each analytic process.