Download
1 / 21
210 likes | 318 Views
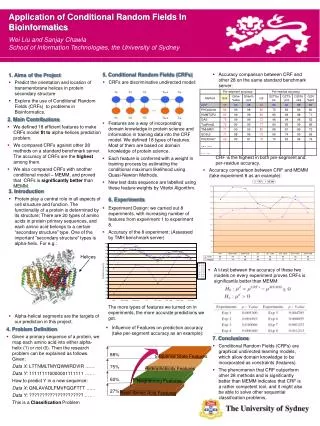
Current differentiation of demographic processes in Lithuania: a census-linked study with population register data Domantas Jasilionis, Aušra Maslauskaitė, Aiva Jasilionien ė, Vlada Stankūnienė and Dalia Ambrozaitienė , Giedrė Smailytė, France Meslé, Jacques Vallin , Vladimir Shkolnikov.

E N D
Current differentiation of demographic processes in Lithuania: a census-linked study with population register data Domantas Jasilionis,Aušra Maslauskaitė, Aiva Jasilionienė, Vlada Stankūnienė and Dalia Ambrozaitienė, Giedrė Smailytė,France Meslé, Jacques Vallin, Vladimir Shkolnikov The research is funded by EU structural assistance to Lithuanian under the measure VP-1-3.1-ŠMM-07-K “Support to Research Activities of Scientists and Other Researchers (Global Grant)” project Nr. VP-1-3.1-ŠMM-07-K-02-067
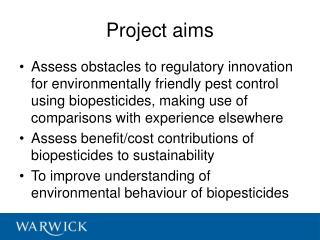
AIMS OF THE PROJECT • to create integrated census-linked longitudinal databases combining population census, demographic register, and contextual data. • to obtain new very important for Lithuania and other EU countriesscientific evidence for complex assessment of demographic differentials and their impact on sustainability of demographic trends. • on the basis of new reliable scientific evidence and innovative methodological solutions to create and disseminate methodological recommendations for development of studies on demographic differentials. • Focus on methods: formal demography, epidemiology, statistics spatial analyses multilevel approach
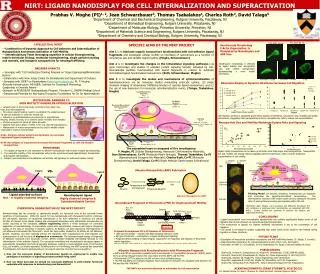
Linkage between census and follow-up for dem. events Cancer diagnosis Divorce Birth by parity Marriage Emigration Death No event Time 2001 OR 2011 CENSUSBeginning of the observation Socio-demographicand socio-economic characteristics CANCER REGISTER: Cancer incidence CENTRAL POPULATION REGISTER: Death, Birth, Marriage, Divorce, Migration CAUSE OF DEATH REGISTER End of observation Frequency dataset: numbers of demographic events and person year of exposureby each combination of categories of available variables. Period or cohort demographic indicators by socio-demographic groupsPuasson regression coefficients (rate ratios)
The key advantages of population-level census-linked data for studying demographic differentials:=> Representativeness: covers entire population. Surveys often exclude some (vulnerable) parts of populations. => Sample size: substantial numbers of demographic events and person years of exposure for statistically robust estimations of demographic rates for sociodemographic groups. => More reliable data for studying mortality differentials: a census-linked approach allows to avoid numerator- denominator bias which is typical for cross-sectional studies using death record information about sociodemographic status of deceased.
Lithuanian census-linked data and their use in research on death, fertility and family events • Examples of studies • Studies in progress • Socioeconomic and sociodemographic mortality differentials. • Socioeconomic differences in cancer incidence and survival. • Socioeconomic and sociodemographic fertility differentials. • Socioeconomic differences in divorce risk. • Individual and contextual determinants of emigration. • Future studies • Migration patterns and determinants. • Family formation. • Changes in demographic differentials 2001-2011.
STUDY #1: NUMERATOR-DENOMINATOR BIAS IN CROSS-SECTIONAL CENSUS-UNLINKED MORTALITY DATA Source: Jasilionis, Stankuniene, Ambrozaitiene, Jdanov, Shkolnikov, 2012.
Lagging behind Estonia in reforming health care?Contributions of amenable causes and IHD to LEB changesbetween 2000 and 2007.
A delayed “cardiovascular revolution”?Trends in SDRs for ischaemic heart disease, 2000-2010.
Importance of health inequalities (1) Economic argument: improving the health of the poor helps them to extract themselves from poverty. Ill-health is an obstacle for economic progress (WHO, 1999). Good health of all individuals in the society should be an ultimate goal of economic development. Ultimately ethical issues – asocio-economic disadvantage and adverse health conditions in some populations should be considered on moral grounds, not in terms of economic return. Most of health inequalities between and within countries are not genetic differences, nor they are biologically inevitable. Therefore, the inequalities can be reduced by appropriate policies in public health, health systems, and other areas (Leon & Walt, 2001). Source: Whitehead, 1992.
Importance of health inequalities (2):Demographic and economic arguments • Mackenbach, Meerding, Kunst (2011): • EVERY YEAR inequality related losses to health in the European Union amount for: • More than 700 thou. avoidable deaths; • 33 mil. prevalent cases of ill-health. • Lithuania: ~20 thou. avoidable deaths at working ages in 2001-05. • EVERY YEARinequality related ECONOMIC losses to health amount: • 1.4% of GDP (or €141 billion) – through avoidable loss of labour productivity; • 5% of the costs of social security systems; • 20% of the costs of healthcare systems.
DIVIDED LITHUANIA: male life expectancy by 24 pop groups Distribution of male life expectancy at age 30 by 24 four-dimensional groups in Lithuania, 2001-2004. Example: 1st group – married Lithuanian men with higher education, residing in urban areas. Difference between ~10% males with the highest e(30)and ~10% males with the lowest e(30) – 20 years! Source: Jasilionis et al.,2007.
STUDY #2: SOCIOECONOMIC DIFFERENCES IN ADULT MORTALITY IN LITHUANIA Poisson regression adult (30-59 years) mortality rate ratios for suicide, by occupation. Lithuania, 2001-2005. Source: Jasilionis, Stankūnienė, 2012.
STUDY #3: SOCIOECONOMIC DIFFERENCES IN CANCER INCIDENCE AND MORTALITY Opposite educational gradients in prostate cancer incidence and mortality, Lithuanian males, aged 40-79, 2001-2004 Source: Smailyte, Jasilionis, Krilaviciute et al. (2012) / Cancer Epidemiology.
STUDY #4: DETERMINANTS OF FERTILITY IN LITHUANIA Using registers to improve quality of fertility statistics Solving a “mystery” of TFR in 2011 (=1.8!!!) TFR (2010) = 1.5 (includes mothers and births de facto abroad but registered as in Lithuania) TFR (2011) =1.8 (excludes mothers abroad, but includes births abroad and/ormothers residing abroad) After correction TFR (2011)=1.55 Identification of status of mothers’ residential status using registers: Central Population Register (last address, registered movements)Social Security Register (Social benefits)Health Insurance Register(Using healthcare services)Tax Register (Regular employment or income, taxes)
STUDY #4: DETERMINANTS OF FERTILITY IN LITHUANIA Trends in Total Fertility Rate, 2001-2012.
STUDY #4: DETERMINANTS OF FERTILITY IN LITHUANIA Ethnic differentials in parity-specific Total Fertility Rate (TFR) and Mean Age at Birth (MAB), 2001-2002. Source: Jasilioniene, Stankūnienė, Maslauskaitė et al. 2012.
STUDY #5: SOCIOECONOMIC DETERMINANTS OF DIVORCE IN LITHUANIA The study is based on 41 thou. first (legal) divorces and 3.18 million person-years of marriage years of exposure. Poisson regression relative first divorce risks by ECONOMIC ACTIVITY STATUSadjusted for all control variables. Lithuania, 2001-2003 MODEL: Additionally controlled for duration of marriage, marriage cohort, age at first marriage, number of children, education, ethnicity, place of residence, place of birth. Source: Maslauskaitė, Jasilionienė, Jasilionis, Stankūnienė, Shkolnikov, 2013.
First divorce risks by economic activity status for females residing: 1) in large cities, 2) other urban areas, 3) rural areas. Controlled for duration of marriage, marriage cohort, age at first marriage, number of children, education, ethnicity, place of residence, place of birth. Source: Maslauskaitė, Jasilionienė, Jasilionis, Stankūnienė, Shkolnikov, 2013.
Emigration determinants Trends in crude emigration and net-migration rates (per 1000), 2001-2012 Source: Kluesener, Jasilionis, Grigoriev, Stankuniene, 2013.
Emigration determinants Poisson regression emigration rate ratios by socio-demographic and socio-economic variables, Lithuanian males and females aged 20-64, 2011-2012 Source: Kluesener, Jasilionis, Grigoriev, Stankuniene, 2013.