Download
1 / 16
160 likes | 276 Views
Alireza Sadrmomtaz 1,2 , David J Parker 1. PET and PEPT Previous PEPT detector systems Development of modular PEPT system Results Future Plans. Modification of a Medical PET scanner for PEPT Studies. 1 School of Physics and Astronomy, University of Birmingham, Edgbaston, B15 2TT, UK

E N D
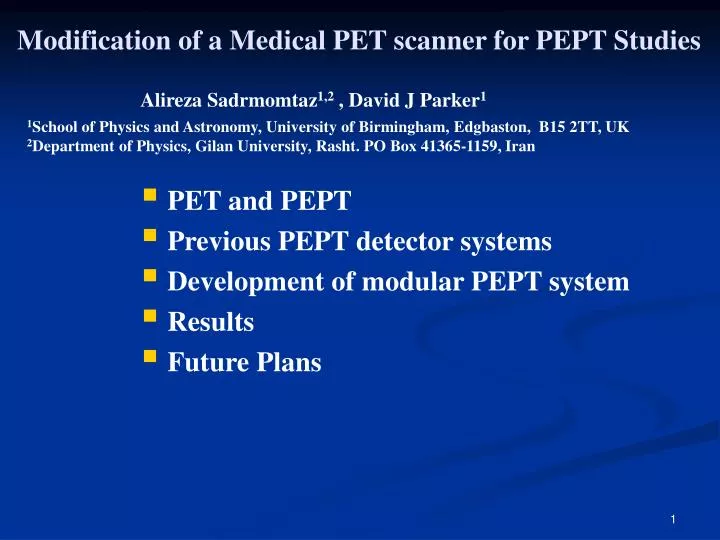
Alireza Sadrmomtaz1,2 , David J Parker1 PET and PEPT Previous PEPT detector systems Development of modular PEPT system Results Future Plans Modification of a Medical PET scanner for PEPT Studies 1School of Physics and Astronomy, University of Birmingham, Edgbaston, B15 2TT, UK 2Department of Physics, Gilan University, Rasht. PO Box 41365-1159, Iran
PET imaging concentration of radioactive tracer • PET is widely used in medicine • At Birmingham, PET used to study engineering processes PET CHARACTERISTICS PET (Positron Emission Tomography) 1-Slow process 2-Requires at least 10 6 events to produce an image 3- Random and scatter events distort the image and can only partially be corrected after backprojection
3-Powerful tool for studying the behaviour of granular materials in systems such as mixers and fluidised beds. PEPT (Positron Emission Particle Tracking) 1-This technique was invented at the University of Birmingham 2-In PEPT a single tracer particle is introduced into the system. The location of this particle tracer can be determined from detection of a small number of pairs of back to back gamma rays, so that this can be achieved many times per second and the track of a particle can be reliably followed.
254 mm 500 mm 10o 285 mm 154 350 Electrical bandheaters 170 924 mm 250 mm Distributor plate 150 239 mm Fluidising Gas Entry point Example of PEPT application High Pressure Fluidised Bed Reactor
PEPT CHARACTERISTICS 1-Single positron emitting particle is used 2-Fast process 3-Needs 102 events to calculate the location of tracer with accuracy around 1mm 4-Random and scatter events will be discarded and do not contribute to calculation of location 5-PEPT results show velocity and dynamical behavior of the system under investigation
1984-1999 1999 PEPT detector systems Multiwire Proportional Chambers Replaced by ADAC gamma camera
ADAC Camera • Consists of two digital gamma camera heads which are used in coincidence. Each head contains a single sodium iodide crystal 590x470x16mm3 backed by 55 PMTs Spatial resolution(PET) 6mm Efficiency each head 23% total/16% photopeak Max true coincidence rate 100kcps Limitations of ADAC scanner 1- Limited countrate 2-Maximum head separation 75cm 3-Not transportable
Installed at Hammersmith Hospital 1987 Presented to Birmingham University 2002 Installed in Positron Imaging Centre 2003-4 Ecat scanner Each bucket Each block Total number of detectors ECAT 931 Scanner 32 detector buckets arranged in two rings each ring 16 detector buckets 4 blocks 32 bismuth germanate crystals 8×4 array dimension 6x12mm2 and 30mm thick coupled to 4 PMTs 4096
Idea Reconfigure ECAT 931 buckets as PEPT system 1-Higher count rate 2-Modular 3-Flexible geometry allowing PEPT tests on larger systems 4- Mobility
Horizontal centre to centre spacing Vertical centre to centre spacing Number of buckets used New geometry • Two rectangular arrays of buckets • Buckets spaced to maximise field of view without allowing any gaps 380 mm, with a gap of 180mm between buckets 100mm, with a gap of 44mm between buckets for this work (can be adjusted) 14, four pairs mounted on one half frame and three pairs on the other
Vertical variation in sensitivity • Diagram 1 shows the variation of measured sensitivity along the central vertical axis • Highest sensitivity obtained was around 2×10⁻² cps/Bq
Diagram 1 Horizontal variation in sensitivity • Diagram 1 shows the variation of sensitivity along a horizontal axis • The efficiency achieved for each block was approximately 50%
Diagram 2 Diagram 1 Count rate • Diagram 1,2 shows the variation of singles and coincidence count rates with activity (measured using a decaying source) • The highest coincidence count rate was about 250 kcps (2.5 times that of ADAC)
Source on a turntable • Diagram shows PEPT results from tracking a source on a turntable mounted at level F and rotating at approximately 12rev/s (6 m/s) • Approximately 110 kevents/s were recorded giving approximately 1100 PEPT locations per second with an accuracy of 1.4 mm in 1D, 4.7mm in 2D and 5mm in 3D
Singles efficiency Max true coincidence rate(kcps) Accuracy for PEPT(1D) PEPT locations/s Speed of particle (m/s) Compared with ADAC ADAC camera New Configuration 23% 50% 100 250 1mm 1.4mm 300 1100 2 6
Future plans • Spread out blocks within each bucket to reduce variations in sensitivity • Use more buckets (up to 32) • PEPT measurements on large vessels • This modular system is transportable, and will be used to perform PEPT studies outside Birmingham