Download
1 / 34
340 likes | 453 Views
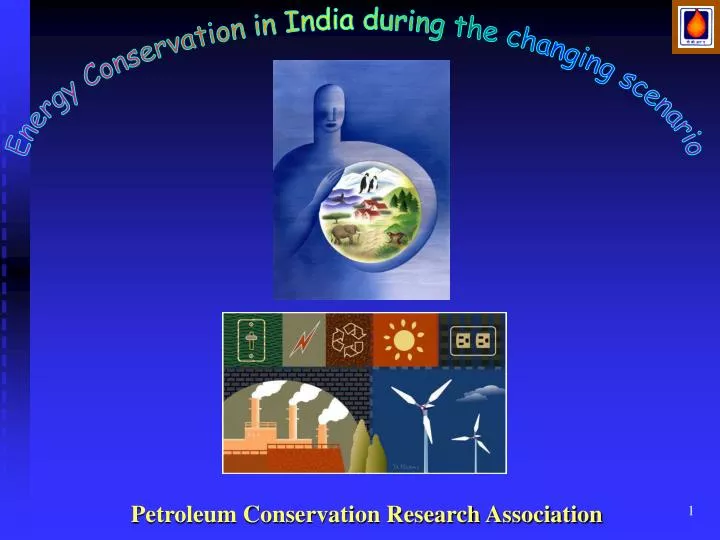
Energy Conservation in India during the changing scenario. Petroleum Conservation Research Association. EMERGENCE OF PCRA. Goal of PCRA. To excel as a centre of "Integrated Energy Solution Provider". PCRA's Strategy. Intensive education campaign for attitudinal changes among masses.

E N D
Energy Conservation in India during the changing scenario Petroleum Conservation Research Association
Goal of PCRA To excel as a centre of "Integrated Energy Solution Provider"
PCRA's Strategy • Intensive education campaign for attitudinal changes among masses. • Information dissemination and capacity building. • R&D activities.
Objectives • Create awareness among masses • Promote research, development and deployment • Establish synergistic institutional linkages • Provide training and technical advisory services • Information dissemination of fuel efficient technologies • Function as a ‘think tank’ for the Govt. of India
Global Primary Energy Reserves • Coal • Global Coal reserve : 9.8 billion tonnes • US has largest share: 25.4%, followed by Russia (15.9%) • India 8.6 % • Oil • Global Oil reserve : 1047 billion bbls • Saudi Arabia has largest share: 25%, • India : 5.5 bn bbls • Gas • Global Gas reserve : 156 TCM • Russia has largest share: 30%, • India : 760 bcm
Availability of conventional energy sources (India) Coal & Lignite Oil Natural Gas Electricity
Renewable Energy Potential and Achievements in India Sources/ Technologies Units Potential Achievements 2002-03
Sectoral consumption of Primary Energy Sectoral Consumption of Energy (350 MMtoE) 100% Others (14%) 49 MMtoE Domestic (10%) 35 MMtoE 80% Agriculture (5%) 17.5 MMtoE Transport (22%) 77 MMtoE 60% 40% Industry (49%) 171.5 MMtoE 20% 0% 1
Energy Conservation • Energy consumption, Economic growth and Population are interlinked • GDP growth in past five decades – 4.9% average • during 92 - 96 : 6.7% • during 97 – 00 : 6.1% • in 2003 – around 8.4% • Population crossed 1 bn in 2000 • Growth in population in last three decades : 2.1%
Energy Scenario • TPES kept pace with population growth • 147 MMtoE in 1970 crossed 500 MMtoE in 2004 • Commercial energy share in TPES • 41% in 1970 70% in 2004 • Dominance of non-commercial energy in rural India • Energy Intensity: • 3.7 times of Japan • 1.55 times of US • 1.47 times of Asian average • 1.5 times of World average
Energy Supply in India • Coal • India is fourth largest producer • Coal offtake : 353 MMT • Consumers : Power 75% & Industry 24% • Oil • Consumption : 115 MMt & Production : 32.8 MMt • Sectoral consumption : • Transport – 53% • Domestic – 18% • Industry – 17% • Gas • Demand : 120 MMSCMD & Production : 68 MMSCMD • Sectoral Consumption • Power – 40%, Fertiliser – 34%, Industries – 16%
Energy Supply in India • Electricity Generation • 5.32 L GWh • Sectoral contribution: • Thermal – 83%, Hydel – 12%, Wind & Nuclear – 3.5% • Percentage share of Natural Gas in Electricity Generation : 7% • It may go upto 15% by 2030 (by IEA) • Consumption: • 3.39 L GWh • Industry – 34%, Domestic – 24.5%, Commercial – 7%
Share Of Non-commercial Energy 1953-54 1980-81 2001-02 2011-12 %Share 71 52 32 23..5 Mtoe 64.13 108.48 139.02 170.25 • The decreasing share of non-commercial energy indicates increasing URBANISATION / INDUSTRIALISATION • The data indicate that the rural population in India continues to rely on traditional biomass-based fuels (fuel wood, crop residues, and animal dung) for meeting its energy needs. • The rural populace constitutes nearly 70% of the population in India and 96% of the rural households use bio-fuels, primarily for cooking. • During the year 2001 – 02 the fuel wood consumption in India was 223 million tonnes and the consumption of animal dung and agro-waste was estimated at 130 million tonnes
Energy Availability from Upsream end At consumer end the energy pattern is different TOTAL ENERGY CONSUMPTION COAL 48 MMTOE ELECTRICITY 30 MMTOE OIL & GAS 126 MMTOE For Other Sector uses 48 MMTOE (97 MMT) Coal Consumption 188 MMTOE (380 MMT) For Power Generation 140 MMTOE (283 MMT) 4.20 LGWH Total 5LGWH After TD loss of 30% 3.5 LGWH 30 MMTOE) Hydro / Nuclear / Wind Energy 0.75 LGWH (22 MMTOE) 0.75 LGWH 0.05 LGWH For Power Generation 14 MMTOE Oil & Gas Consumption 140 MMTOE For Primary uses 126 MMTOE TOTAL 350 MMTOE TOTAL 204 MMTOE
Potential for Energy Saving • Total Energy Consumption – 350 MMTOE • Total foreign exchange outgo – Rs.110,000 crores per annum. • Oil & Gas Consumption – 140 MMTOE • Potential for saving Energy – 15% • Total Energy Saving Potential – 50 MMTOE • Money Equivalent – Rs.50000 Crores(@ Rs.10000/ ton) Hence the need for Conservation
MOP&NG & Conservation • Oil and Gas are major sources of energy. At production level it accounts for 42% . • Oil accounts for major portion of import bill. • More than 70% of demand met through imports at substantial cost. • Foreign Exchange outgo of approx. Rs.110,000/- Crores and will increase further in year 2004-05. • Limited Reserves. • Bigger scope for R&D to develop fuel efficient products / processes/devices • Efficient Management and usage of gaseous fuels like CNG/LNG/CBM • By the initiative of MOP&NG, setting - up of Ministerial Committee for integrated energy conservation policy. • Global competitiveness through energy efficiency. Conservation is imperative for MOP&NG & the Country
Sectoral Approach COMMERCIAL INDUSTRY AGRICULTURE PCRA DOMESTIC TRANSPORT
Industrial Sector 1985-2004 • Energy Audits +FODS+SSIs conducted 11883 + 24594 follow-ups • Institutional Training Programs organized 1388 • PCRA is the organization having capabilities to perform Energy Audits in various types of Industries and sizes all over the country and in such large numbers at flexible rates. During 2003-04 • Energy Audits + FODS + SSI =850 • Energy Audits of 84 Pumping Stations OF MCD. • Energy audit for 61 units including 14 Dairy Plants, 32 Chilling Units & 9 Cattle Feed Plants of M/s Amul Dairy, Gujarat. • Energy Audit of 62 hand tool industries in Jalandhar for UNIDO • 35 commercial buildings Savings realized through Energy Audits – 70276 KLOE - Rs.78 Crores
Transport Sector 1985-2004 • Model Depot Project Studies 1696 • Driver Training Programmes 4014 • Drivers Trained 71000 • Increase in KMPL in STUs 4.1 to 4.61 • PCRA is the only organization which conducts Driver Training Programs ( KMPL improvement ) in organized & unorganized sector in a structured way. During 2003-04 • Work Order placed by BEST to train 15000 drivers & other technical personnel. • DTPs for 26 Dealer’s Network of M/s Eicher Tractors all over the country. • Training for 750 Drivers on payment basis for MCD. • MDP of 25 BEST depots in Mumbai on payment basis. Savings realized through PCRA’s efforts 33676 KLOE Rs.58.93 Crores
Domestic Sector OBJECTIVES Education on :- • Good cooking habits • Good driving habits • Youth Programs • Fuel Efficient BIS marked Kerosene / LPG stoves and lighting appliances. • Use of alternate sources of energy i.e. LNG, LPG, BIOFUELS, SOLAR etc. • Youth Programmes (1999-2004) 8237 • LPG Clinics including workshops(1985-2004) 17021 • Two wheeler women’s rallies (2003-2004) 13 Savings realized 115757 KLOE Rs.137 Crores (during 2003-04)
Agriculture Sector 1985-2004 The activities under the Agriculture Sector include Promotion of BIS marked Fuel Efficient Lift Irrigation Pumpsets and Footvalves, Rectification / Replacement of Non BIS LIP Set and Footvalves with BIS make and setting up Demonstration Centres. • Rectification of LIPs & Footvalves 30212 • Demonstration Centres 411 • Van Publicity 3537 During 2003-04 • In Nov.2003, an Agriculture survey scheme involving rural school children has been launched. 400 students participated in the scheme and surveyed 2032 farmers to collect data for rectification plan. Saving Realized 338 KLOE - Rs.0.60 Crores
Integrated Energy Conservation Strategy - Conclusions • To meet the energy needs of all segments in most efficient and • cost effective manner with long-term sustainability • Provision of clean and affordable energy through decentralized • energy service providers • Ensuring security of Energy Supply • Map all energy resources in view of choices, efficiencies and cost effectiveness • Commercially driven goal oriented and decentralized R&D efforts • Energy Plans for unforeseen emergencies
Integrated Energy Conservation Strategy - Conclusions • Improving the efficiency of Energy System • Empowered regulatory authorities • De-linking the social function of subsidy provision from energy pricing decisions • Institutionalization of Information System, Communication and Education Program • Reduction of adverse environmental impacts • Development of environment friendly technologies • Exploiting opportunities through upcoming international treaties e.g. Kyoto etc. • Establishment and enforcement of appropriate environmental standards
Indian Growth Scenario 1. There are two indicators pointing to the fact that India is already on a path of growth and development: • One is that the energy intensity of India (for the year 2001) is the same as in OECD Countries, when GDP is calculated in terms of Purchasing Power Parity (PPP). • Energy – GDP elasticity, which is the ratio of the growth rate in energy to the growth rate in GDP has been continuously decreasing since the mid-seventies from the steady value of 1.3 for the previous two decades. Electricity-GDP elasticity which was as high as 3.0 in the mid sixties has also been decreasing and in 1991-2000 was ~1.213; for the same period the primary energy–GDP elasticity has come down to 0.907.
Increasing Use of Non-Conventional Energy • Today, India has perhaps the only Ministry of Non-Conventional Energy Sources in the world. • The country has the largest solar energy program, the second largest biogas and improved cook stoves program and the fifth largest wind power program in the world. • The renewable energy sources have begun to emerge as an attractive option, sometimes the only one, to provide light and power to areas too remote for grid electrification. • Promotion of renewable energy sources is an integral component of the country’s strategy for sustainable development.
Conclusion • Energy consumption is an indicator of any country’s prosperity • Conservation doesn’t mean – “ No use of energy” rather it indicates – • “ Efficient utilization of Energy” • One unit of energy saved at end-use is equivalent to Four units of Energy at upstream end